Visualization modes
Nine ways to watch your hardware think
Press v to cycle, or jump directly with a (Arcade),
d (Defrag), g (Insights), i (Inference
Server Monitor), or ~ (HivemindSweeper). Every mode reads the same
live telemetry — power, temperature, aiclk, DDR state — and renders it
differently. Recordings below are from real 4× Blackhole hardware during live
LLM inference.
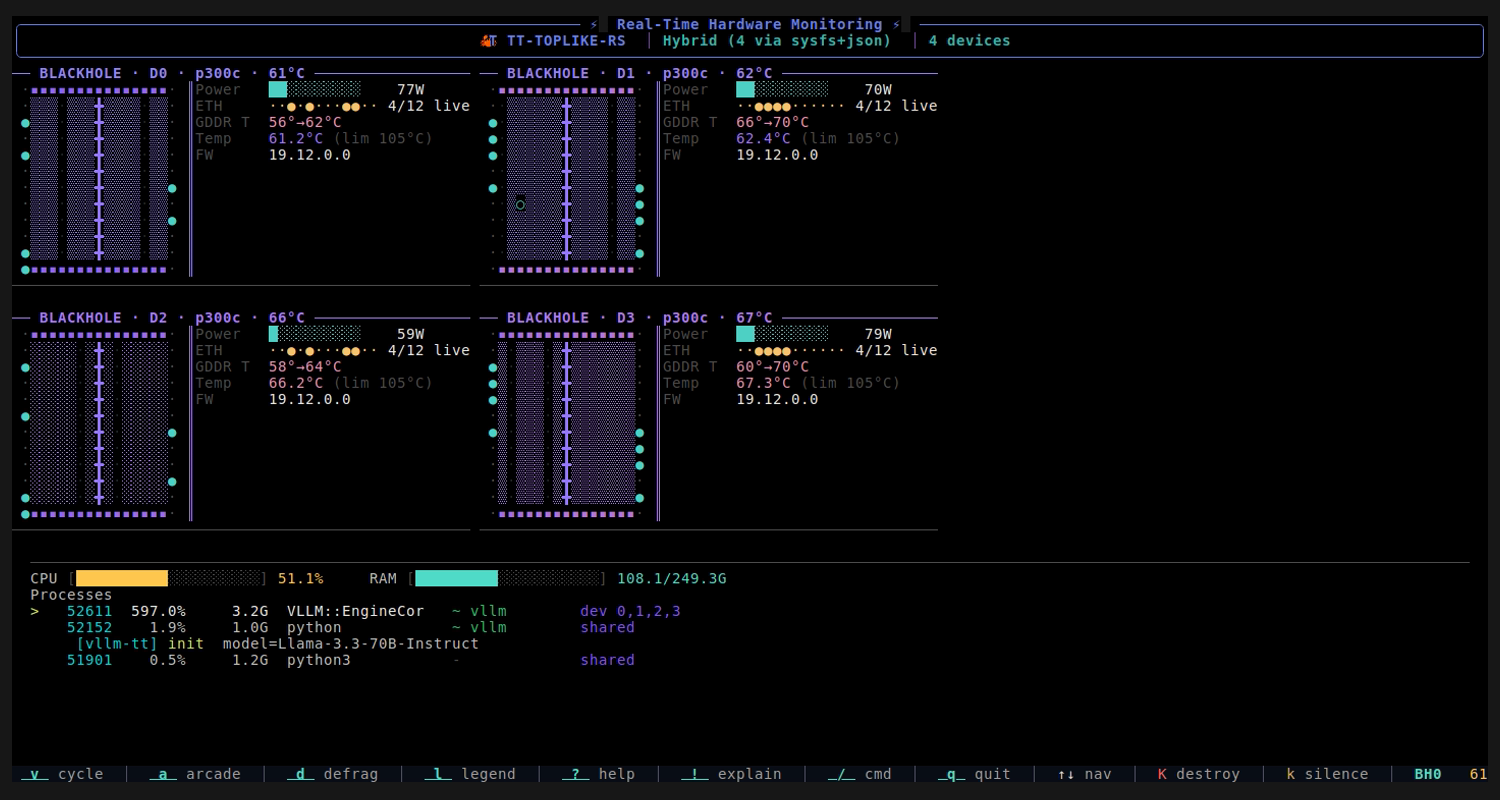
Insights
Live per-chip telemetry panels. Power, temperature, DDR training status, ARC firmware health, and an active process list — all in one view. The adaptive baseline learns your chip's idle state so all activity is shown relative to what's normal for your hardware.
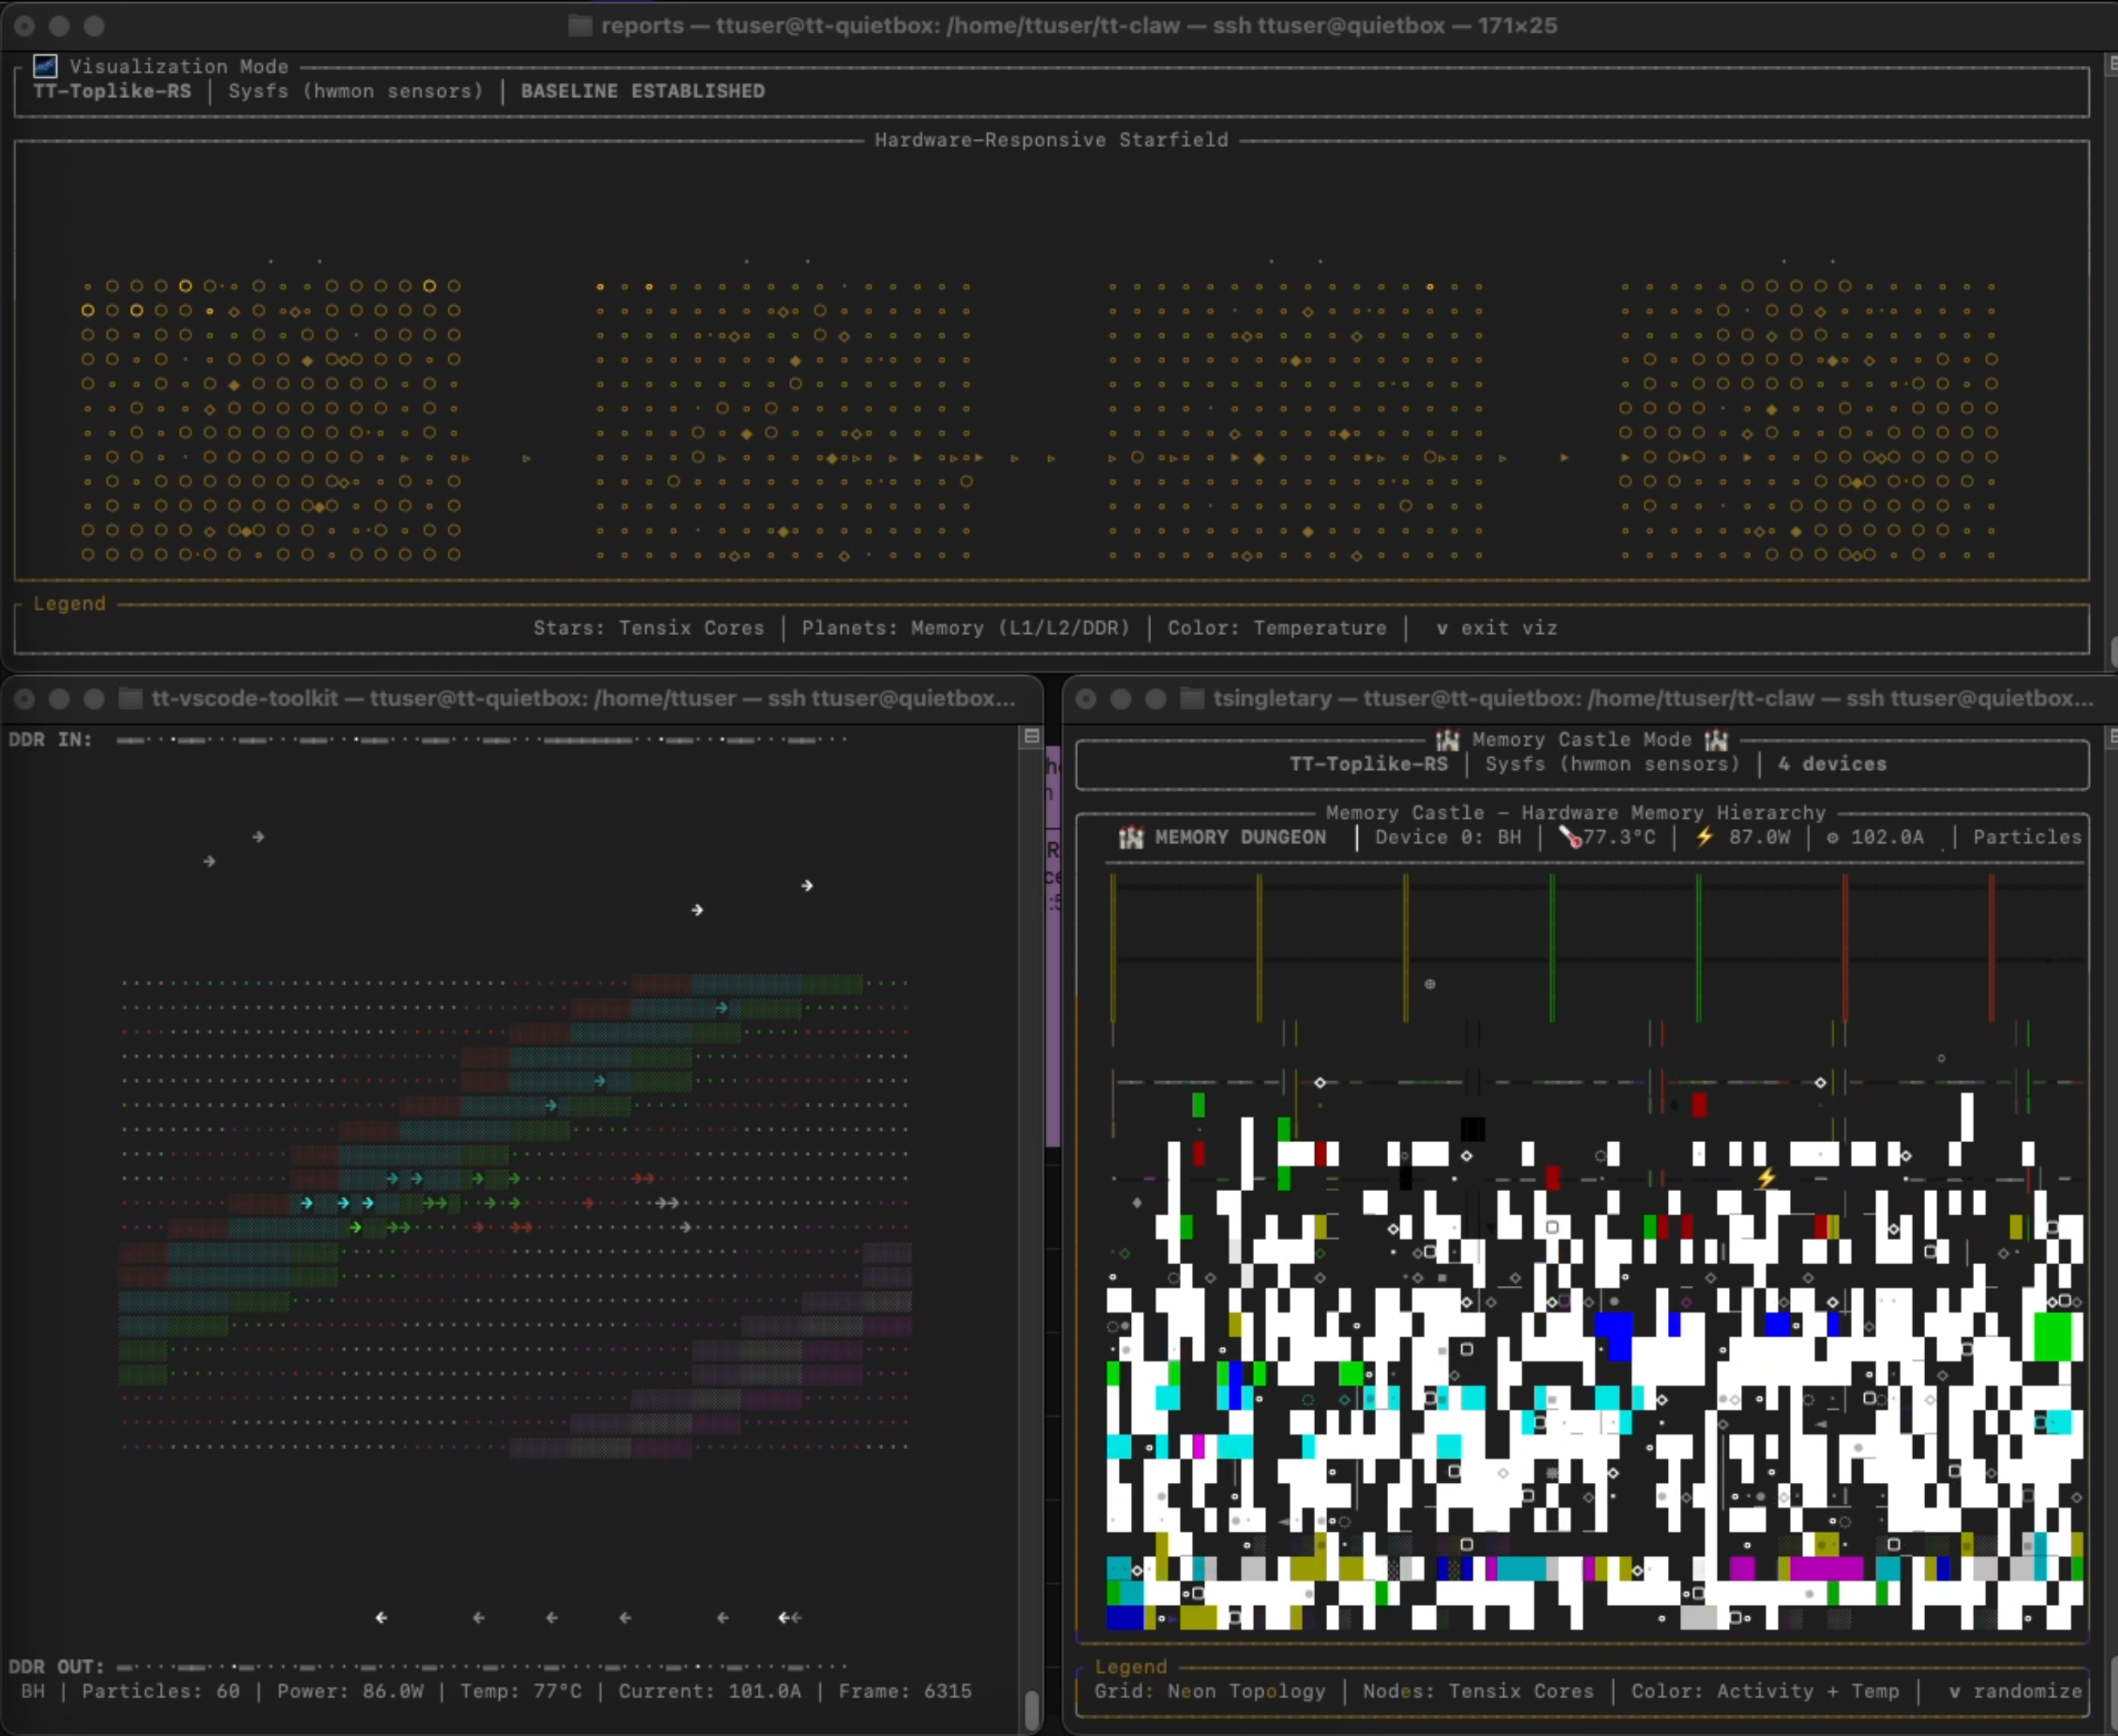
Tensix Starfield
Every Tensix core is a star. Brightness encodes power fraction above idle;
color hue encodes die temperature (cyan at cool, red at hot); character
weight (·∘○◉●) encodes activity level; twinkle phase encodes
current draw. During LLM inference, stars pulse in sync with each token's
compute burst then settle back to idle shimmer.
Memory Castle
A roguelike dungeon representing the memory hierarchy: DDR at the bottom, L2 cache in the corridors, L1 and Tensix at the top. 600 particles per chip flow upward — Read, Write, CacheHit, and CacheMiss each rendered differently with trails. Spawning density and speed track live power. During inference the dungeon fills and seethes; at idle it breathes slowly.
Memory Flow
GDDR channels as horizontal streams. One bar per DDR channel (up to 12 on Blackhole); fill state shows trained/active status; particles flow left-to-right with speed and density driven by bandwidth. Hue rotates 30° per channel so all 12 fan across the full color wheel. Most meditative mode — watch the inference rhythm emerge as a wave.
Defrag
Norton SpeedDisk-style block map: one row per GDDR channel, blocks fill
left→right as model weights DMA in. During inference, blocks glow — brightness
from power, saturation from GDDR temperature, palette shifting warmer as
the chip heats. Scatter bursts flash on power spikes (each token's compute
burst visible as a flash). When a model unloads, the EVICT
animation dissolves blocks right→left at prime-staggered rates, then DMA
rebuild restarts from scratch.
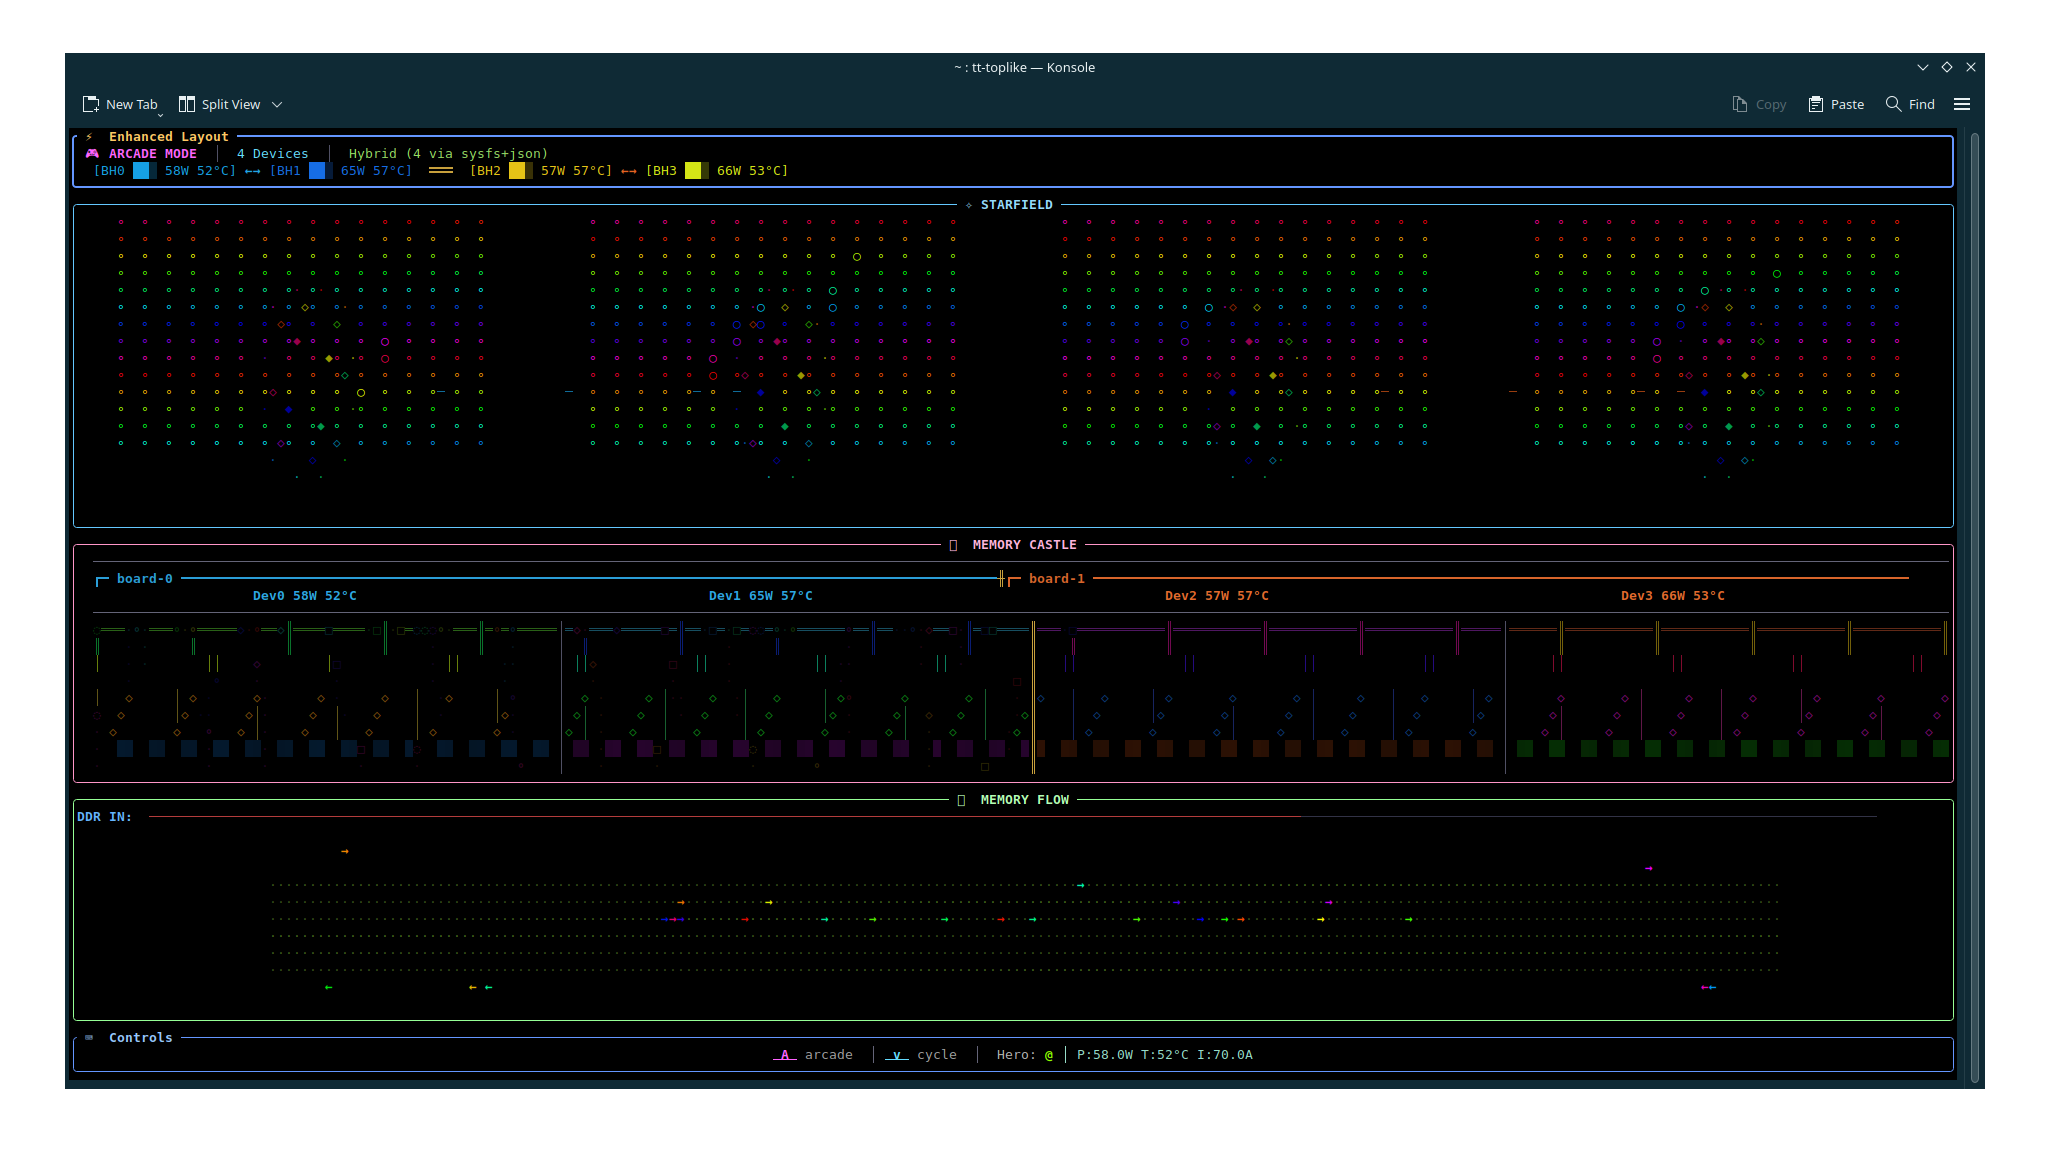
Arcade
All visualizations at once: Starfield (top 40%), Memory Castle + Defrag
block map side-by-side (middle 30%), Memory Flow (bottom 30%).
A @ hero character roams the canvas — X position = current draw,
Y position = power, color = temperature, speed and trail length = aiclk and
ETH link count. The fullest picture of what your hardware is doing. And when a
model is serving locally, the hero squares off against the inference snake in a
telemetry-true tug-of-war — the ⚔ marker slides toward whichever
side dominates (chip power vs tokens/s and queue depth).
Inference Monitor — waiting
Press i for the Inference Server Monitor: one "snake" that threads
through every state of a tt-inference-server. Idle, a hungry snake roams a
starfield of the model catalog — each star a model that runs on your
architecture. The screensaver, waiting for work to arrive.
Inference Monitor — loading
When a model loads, the snake coils and grows through the compile → load → ready journey, shaded with classic ANSI block-ramp gradients. This is the wait the tool was born to fill: concrete evidence of progress instead of a silent log during a long first-run kernel compile.
Inference Monitor — serving
Once serving, it becomes a live dashboard driven by the vLLM
/metrics endpoint and per-chip telemetry: a throughput timeline,
the token-exhaust snake, request swimlanes (queue → prefill → decode), a stats
panel, and a silicon strip correlating tokens with real power and temperature.
Grayskull theme
Type /theme grayskull to collapse the whole palette, app-wide, to
a thousand shades of grey — with a cyan tint for cool signals, a little purple,
and hot pink as the only truly hot color. Shown here over the Arcade duel.
/theme default restores full color.
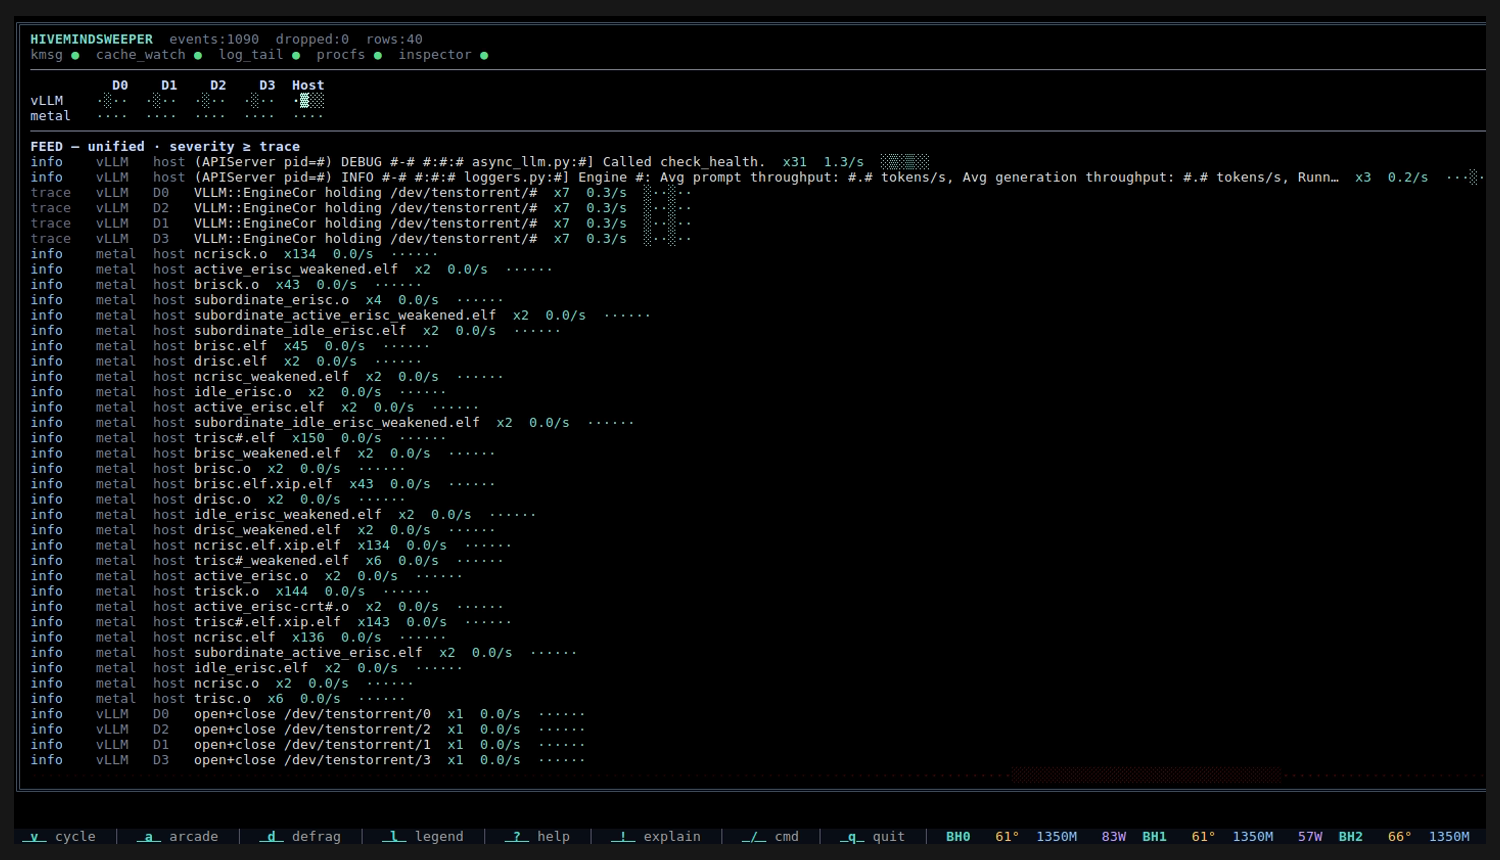
HivemindSweeper
An opt-in, read-only activity sniffer for "what's touching my hardware
right now — and is it making progress?" — built for when the
interesting work isn't logging where you're watching. It folds driver
messages, tt-metal compile-cache churn, /proc device-fd
activity, log tails (incl. docker logs), and the tt-metal
Inspector into one source × device board and a coalesced feed:
repeats collapse to a single row with a live count, rate, and sparkline —
metal · ncrisc.elf ×136, vLLM · holding …,
serving throughput dug out of DEBUG logs. The red KITT scanner slows and
focuses as activity climbs.
Host CPU mode experimental
No Tenstorrent hardware yet? Run tt-toplike --host on
Linux or macOS (Windows builds + tests in CI; runtime not yet validated). CPU frequency maps to aiclk, package
temperature to die temp, RAM usage to DDR fill. Every visualization
works — your CPU cores glow as stars, your RAM drives the DDR channel
bars. Preview all the modes on the machine you already have, before your
Tenstorrent cloud instance, cards, or towers arrive.
One quirk: in host mode the visualizer runs on the very CPU it's watching, so rendering at high FPS heats and loads that CPU — and you see it in the visualization. You're partly watching tt-toplike watch itself. On a real TT card the tool watches a separate chip and never steals compute from your workload. And each hardware type — Grayskull, Wormhole, Blackhole, a multi-card tower — shows something host mode can't: the point is to learn the visual language now.