Tracing Support
The firmware running on TT platforms includes support for tracing using the Zephyr Tracing Subsystem. This allows developers to collect and analyze runtime data to help with debugging and performance optimization.
Enabling Tracing
To enable tracing for the tt_blackhole platform, you need to add the tracing
configuration overlays to your build command. For example, to enable tracing
when building for the p150a board revision, you would use the following command:
west build -b tt_blackhole@p150a/tt_blackhole/smc --sysbuild <tt_zephyr_platforms>/app/smc -- -DEXTRA_CONF_FILE=tracing.conf -DEXTRA_DTC_OVERLAY_FILE=tracing.overlay
west flash -r tt_flash --force
Adding Custom Trace Events
You can add custom trace events to your application using the Zephyr tracing API.
Include the tracing header and use the sys_trace_named_event macro:
#include <zephyr/tracing/tracing.h>

/* ... */

/* Log a named event with two integer arguments */
sys_trace_named_event("my_event", 123, 456);
For more details, refer to the Zephyr API documentation.
Getting Tracing Tools
A custom tool is used to collect trace data, tt-tracing. You can build this
tool from the source code included in the repository:
$ make -C scripts/tooling OUTDIR=/tmp tt-tracing
$ /tmp/tt-tracing
E: parse_args(): Missing required filename argument
Firmware console application for use with Tenstorrent PCIe cards
Copyright (c) 2025 Tenstorrent AI ULC


usage: tt-tracing [args..] <filename>

args:
-a <addr>          : vuart discovery address (default: 800304a0)
-b <bar_idx>       : BAR index to use (0 or 4, default: 0)
-c <channel>       : channel number (default: 1)
-d <path>          : path to device node (default: /dev/tenstorrent/0)
-h                 : print this help message
-i <pci_device_id> : pci device id (default: b140)
-m <magic>         : vuart magic (default: 775e21a1)
-q                 : decrease debug verbosity
-v                 : increase debug verbosity

<filename>         : output file for tracing data
Beyond this babeltrace2 is required to read and analyze the trace data. You can
install this tool using your system’s package manager. For example, on Ubuntu:
$ sudo apt install babeltrace2==2.0.4
Collecting Trace Data
Warning
Trace data collection can interfere with real-time performance. Please avoid running timing-critical operations (like flashing the firmware) while tracing is active.
Note
When running tt-burnin in parallel, tracing on bar0 (with the increased
tx-cap) starts significantly slower compared to tracing on bar4.
Users are recommended to use bar4 when possible for better performance.
In order to collect trace data, you will need to copy the CTF metadata file into a location where your tracing tools can access it:
$ mkdir trace_data
$ cp $ZEPHYR_BASE/subsys/tracing/ctf/tsdl/metadata trace_data/
Then, run the tt-tracing tool, specifying the output file for the trace
data. Tracing will continue until you stop the tool (e.g., by pressing
Ctrl-C):
$ /tmp/tt-tracing trace_data/trace
# Babeltrace2 will read the metadata file automatically
$ babeltrace2 trace_data/
You should see output similar to the following, indicating that trace data has been successfully collected:
[18:00:09.825226532] (+0.000683253) isr_enter:
[18:00:09.825233668] (+0.000007136) isr_exit:
[18:00:09.825237968] (+0.000004300) thread_switched_out: { thread_id = 268577452, name = "idle" }
[18:00:09.825248572] (+0.000010604) thread_switched_in: { thread_id = 268577956, name = "sysworkq" }
[18:00:09.825262563] (+0.000013991) semaphore_take_enter: { id = 268569540, timeout = 4294966296 }
Analyzing Trace Data
Trace data is output in the Common Trace Format (CTF), which can be analyzed
using various tools, including babeltrace2. If you would like to convert the
trace data to the Chrome Trace Format for viewing in perfetto, you can use
the following command:
# Note- deactivate virtual environment if using one, otherwise
# babeltrace2 bindings may not be found
$ python3 ./scripts/ctf_to_chrome.py -t trace_data -o trace.json
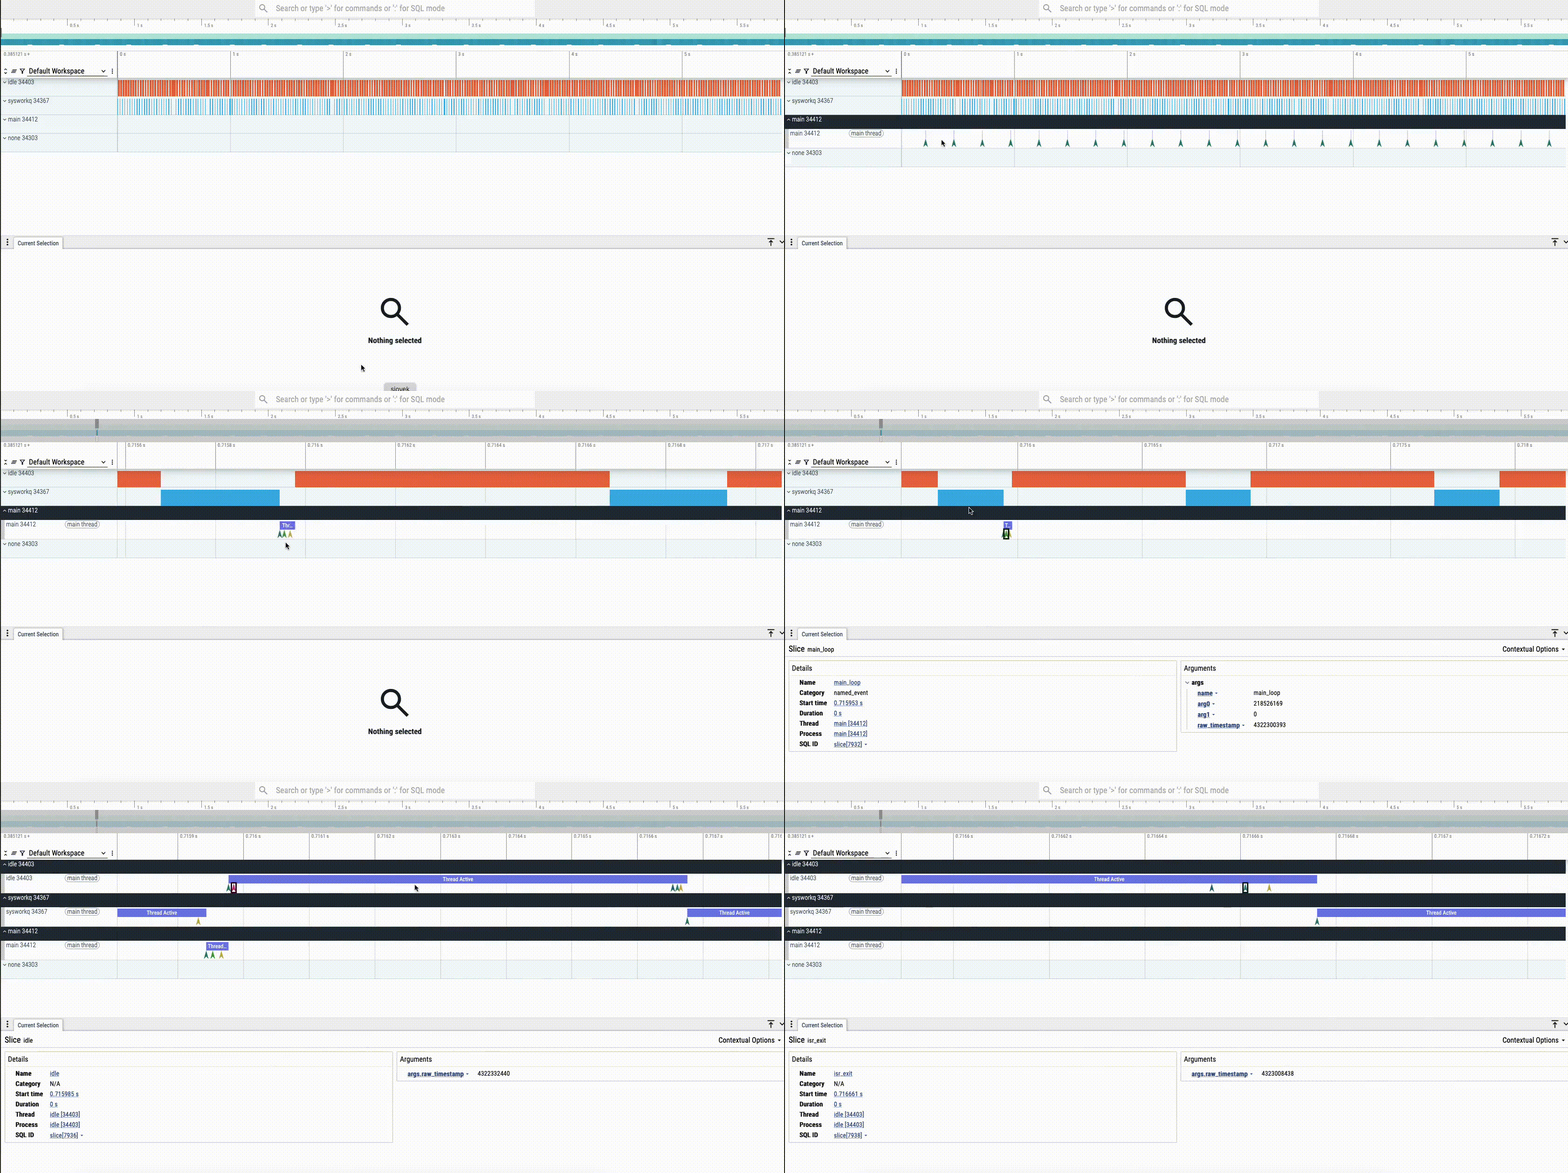
Trace data can then be viewed in the Perfetto UI by uploading the
trace.json file:

Troubleshooting
If you see a log like the following when running tt-tracing, it indicates
that tracing data is being output faster than it can be collected. Try disabling
specific portions of the tracing subsystem (CONFIG_TRACING_* options) in
tt-zephyr-platforms/app/smc/tracing.conf to reduce the volume of trace data being generated.
E: vuart_read(): TX overflow detected, resetting flag