tt-toplike
official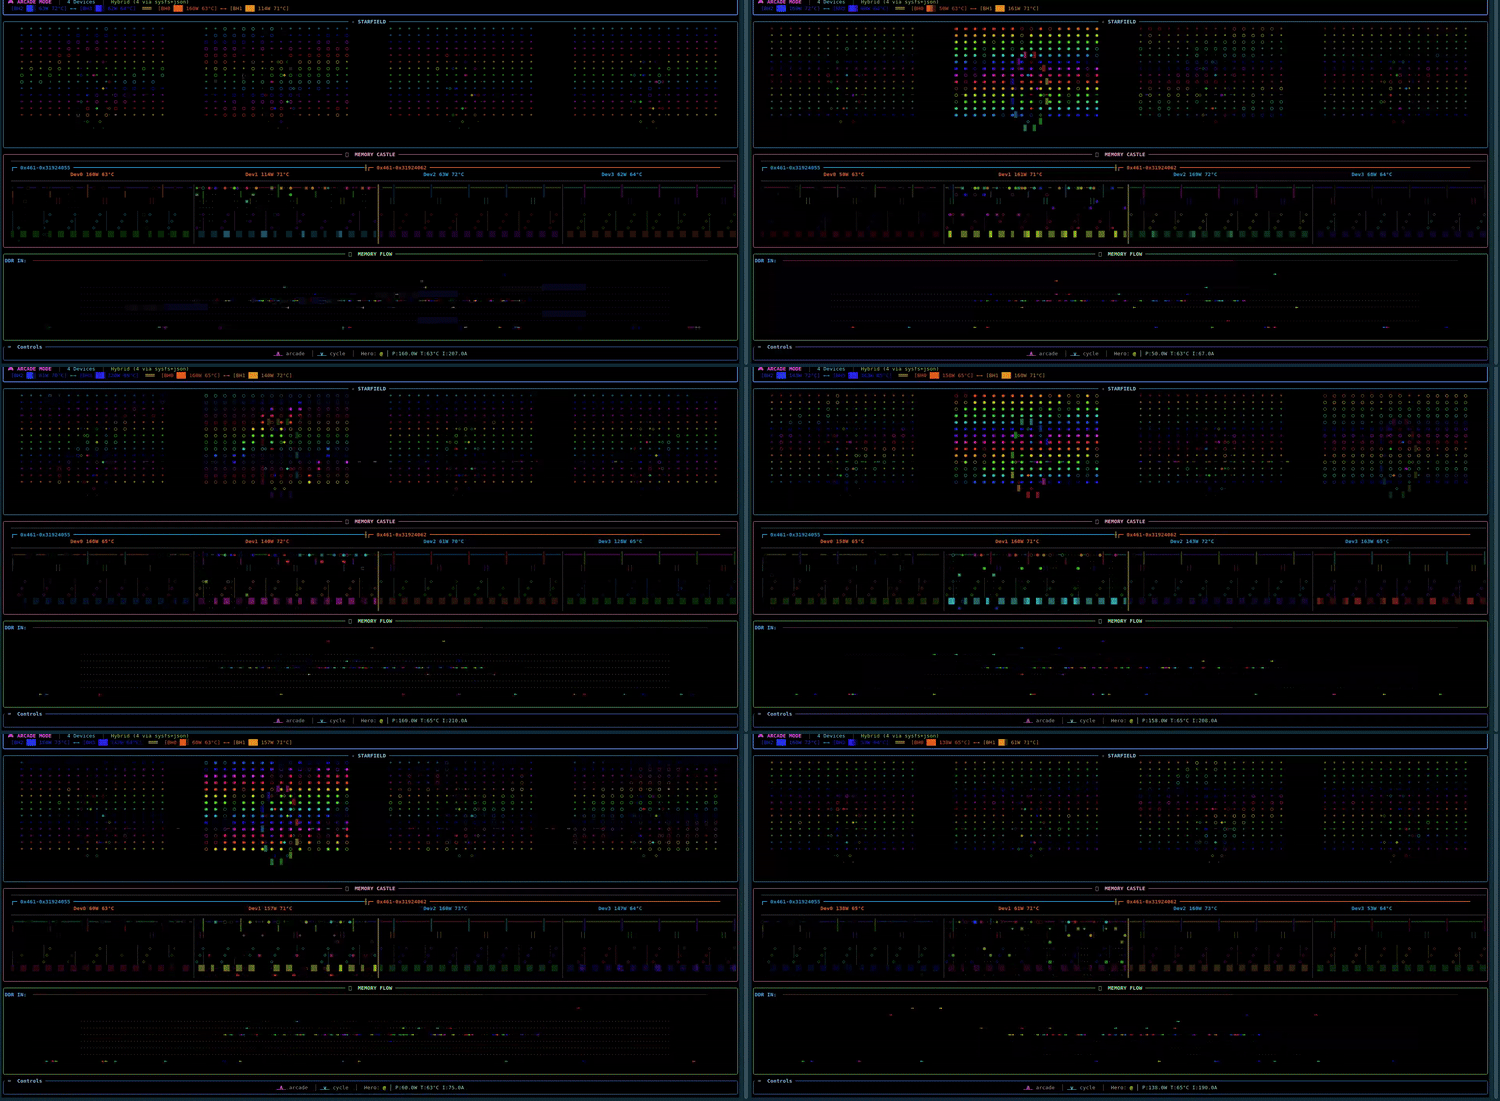
A vibrant htop-style visualizer for Tenstorrent hardware written in Rust. Real-time process and utilization view for TT accelerators.
Releases
🐧
tt-toplike-app_0.13.10_amd64_jammy.deb
🐧
tt-toplike-app_0.13.10_amd64_noble.deb
📦
tt-toplike-tui-0.13.10-macos-universal.tar.gz
⬇
tt-toplike-tui-0.13.10-windows-x86_64.zip
+2 more
⚙ Requires PPA — setup instructions ↗
⚙ Requires PPA — setup instructions ↗
4 previous releases
📋 Changelog
# Changelog

The **canonical, complete release log lives in [`debian/changelog`](debian/changelog)** —
that's the file the `.deb` packages are built from and where every release is
recorded in full. This file is a friendly pointer plus a summary of the most
recent releases; it deliberately does not duplicate the whole history.

To see everything:

```bash
less debian/changelog          # full history
git tag                        # released versions
```

## Recent releases

Releases 0.11.1 through 0.13.9 are recorded only in `debian/changelog`; this
list is a summary and is not kept for every release.

### 0.13.10
- **Add**: Inference view (`i`) shows the port and chips each model runs on,
  for example `:8000 · chips 0,1`, on each roster row or in a header line for a
  single model.
- **Add**: `--tt-smi-reset-behavior` (`ignore`, `inform` default, `dazzle`,
  `demo`). A `tt-smi -r` in another terminal shows in the status bar of every
  view. `dazzle` adds a takeover box with one of five animations (Quiet
  Notice, 128 Blackholes, a BBS sysop chatbot, TT-TREKLIKE, Silly Cetacean);
  `demo` plays all five at start and on every real reset.
- **Change**: the legend (`l`) and explain (`!`) text for the Training,
  Inference, HivemindSweeper, Insights, Defrag and Memory Castle views matches
  what they draw now; the Help panel shows the reset status segment.

### 0.11.0
- **Add**: Training view (`t`) — a full-screen visualization of a live
  tt-train run, drawn as the network it is: a character grid of transformer
  blocks and attention heads fed by token particles, a loss "mountain range"
  under a twinkling aurora nightscape that opens up as the model converges,
  plus chip telemetry alongside it.
- **Auto-attaches with no command**: scans running processes for a tt-train
  example binary (`nano_gpt`, `mnist_mlp`, `linear_regression`), then resolves
  `/proc/<pid>/fd/1` to find and tail that process's log. Checkpoint saves
  are detected by mtime on the run's rolling checkpoint file.
- **Honest limitation**: tt-train's per-step stream can only be tailed if its
  stdout was redirected to a real file at launch (`> train.log`). If fd 1 is
  a pipe or tty, retroactively reading it is an OS-level impossibility, not a
  gap in this tool — the view says so and falls back to what it can still
  see (process liveness, chip telemetry, and checkpoint mtime) rather than
  drawing a fake loss curve. Gradient norms, MFU, and throughput counters
  aren't emitted live either, so the view derives tokens/sec and ETA only
  from what it can actually read.
- Nine independent color channels (loss magnitude, run-history timeline,
  loss-delta direction, forward/backward sweep cadence, cache compile/steady
  state, checkpoint bursts, plus chip temp/power) — see the new legend and
  explain overlays.

### 0.10.3
- **Security fix**: a direct-vLLM host process's own `PATH` was forwarded
  onto the `sh` the monitor spawns to probe it — a bare `Command::new("sh")`
  lookup re
Works on
wormhole
blackhole