Device Program Profiler
Note
Tools are only fully supported on source builds.
Overview
Device-side performance profiling follows the same scope based profiling method that tracy uses on the host side.
The macro DeviceZoneScopedN( zone_name ) is used similar to tracy’s ZoneScopedN macro to profile C++ scopes and assign them a custom name.
How to Run
Device-side profiling is only allowed in profiler builds. build_metal.sh --enable-profiler --build-programming-examples is the script for building profiler builds.
Because downloading profiler results can add high runtime overhead, TT_METAL_DEVICE_PROFILER=1 environment variable has to be set to perform the download.
The commands to build and run the full_buffer example after following Getting Started:
cd $TT_METAL_HOME
build_metal.sh --enable-profiler
TT_METAL_DEVICE_PROFILER=1 ./build/programming_examples/profiler/test_full_buffer
The generated csv is profile_log_device.csv and is saved under {$TT_METAL_HOME}/generated/profiler/.logs by default.
build_metal.sh --enable-profiler --build-programming-examples also enables tracy for the build by using the ENABLE_TRACY=ON cmake option. In tracy builds, device-side profiling data is also sent to tracy’s GUI.
Example
Description
full_buffer is a profiler programming example. It show cases how we can use DeviceZoneScopedN to annotate time on kernel code.
In this example device side profiling is used to measure the cycle count on the series of “nop” instructions that are looped.
The host code of the full_buffer example is in {$TT_METAL_HOME}/tt_metal/programming_examples/profiler/test_full_buffer/test_full_buffer.cpp
On top of tt_metal’s program dispatch API calls, two additional steps specific to this example are taken, which are:
Setting
LOOP_COUNTandLOOP_SIZEdefines for the kernelsCalling DumpDeviceProfileResults after the call to Finish to collect the device side profiling data
The kernel code for full buffer is in {$TT_METAL_HOME}/tt_metal/programming_examples/profiler/test_full_buffer/kernels/full_buffer.cpp and demonstrated below:
 1// SPDX-FileCopyrightText: © 2023 Tenstorrent Inc.
 2//
 3// SPDX-License-Identifier: Apache-2.0
 4
 5#include <cstdint>
 6
 7void kernel_main() {
 8    for (int i = 0; i < LOOP_COUNT; i ++)
 9    {
10        DeviceZoneScopedN("TEST-FULL");
11//Max unroll size
12#pragma GCC unroll 65534
13        for (int j = 0 ; j < LOOP_SIZE; j++)
14        {
15            asm("nop");
16        }
17    }
18}
The inner for loop of “nop” instructions is executed multiple times. The count is determined by the define variable LOOP_COUNT defined by the host side code.
Device-side profiler provides marker information for all RISCs and cores used in the program. The following is the portion of the output csv of the full_buffer test for BRISC on worker core 1,1 on device 0:
ARCH: grayskull, CHIP_FREQ[MHz]: 1202
PCIe slot, core_x, core_y, RISC processor type, timer_id, time[cycles since reset], stat value, Run ID, zone name, zone phase, source line, source file
0,1,1,BRISC,53427 ,11233712278980,0,0,BRISC-FW    ,begin,315,tt-metal/tt_metal/hw/firmware/src/brisc.cc
0,1,1,BRISC,118963,11233712334431,0,0,BRISC-FW    ,end  ,315,tt-metal/tt_metal/hw/firmware/src/brisc.cc
0,1,1,BRISC,25255 ,11233712279447,0,0,BRISC-KERNEL,begin,40 ,tt-metal/tt_metal/hw/firmware/src/brisck.cc
0,1,1,BRISC,90791 ,11233712325701,0,0,BRISC-KERNEL,end  ,40 ,tt-metal/tt_metal/hw/firmware/src/brisck.cc
0,1,1,BRISC,36986 ,11233712279499,0,0,TEST-FULL   ,begin,10 ,./kernel.cpp
0,1,1,BRISC,102522,11233712279792,0,0,TEST-FULL   ,end  ,10 ,./kernel.cpp
0,1,1,BRISC,36986 ,11233712279863,0,0,TEST-FULL   ,begin,10 ,./kernel.cpp
0,1,1,BRISC,102522,11233712280147,0,0,TEST-FULL   ,end  ,10 ,./kernel.cpp
0,1,1,BRISC,36986 ,11233712280205,0,0,TEST-FULL   ,begin,10 ,./kernel.cpp
0,1,1,BRISC,102522,11233712280470,0,0,TEST-FULL   ,end  ,10 ,./kernel.cpp
.
.
.
.
You can see that the log starts with BRISC-FW and BRISC-KERNEL begin and end entries. These are always present in device profiler data. Following the source file and line number presented in the log is the best way to understand what scope in code they are profiling.
In short, BRISC-FW is profiling the duration of a single iteration of BRISC forever loop. BRISC-KERNEL is profiling the duration of the kernel main function.
After the default markers, the log presents the data for the TEST-FULL zone from the full buffer test. Source file is pointing to the intermediate kernel source file that gets
generated. Future updates will make this field to point to the original kernel file.
In total profiling 125 scopes are supported by device-side profiler. In the snippet above, only the first three entries for the TEST-FULL scope is shown.
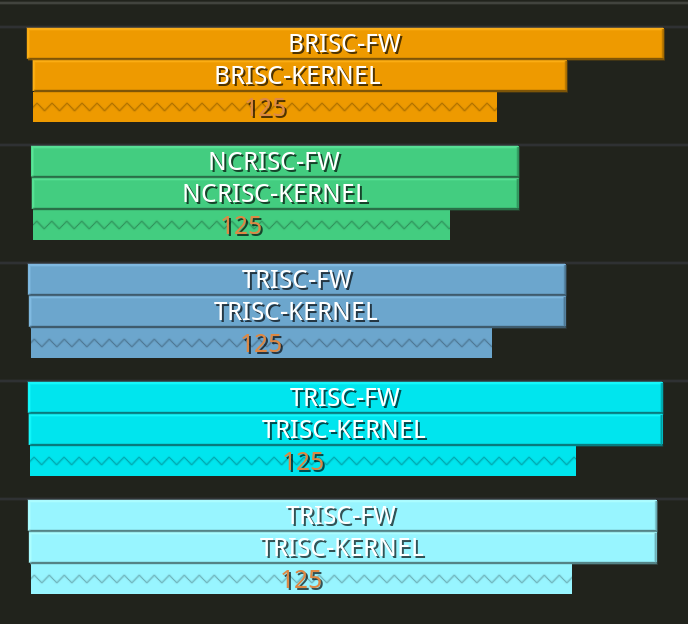
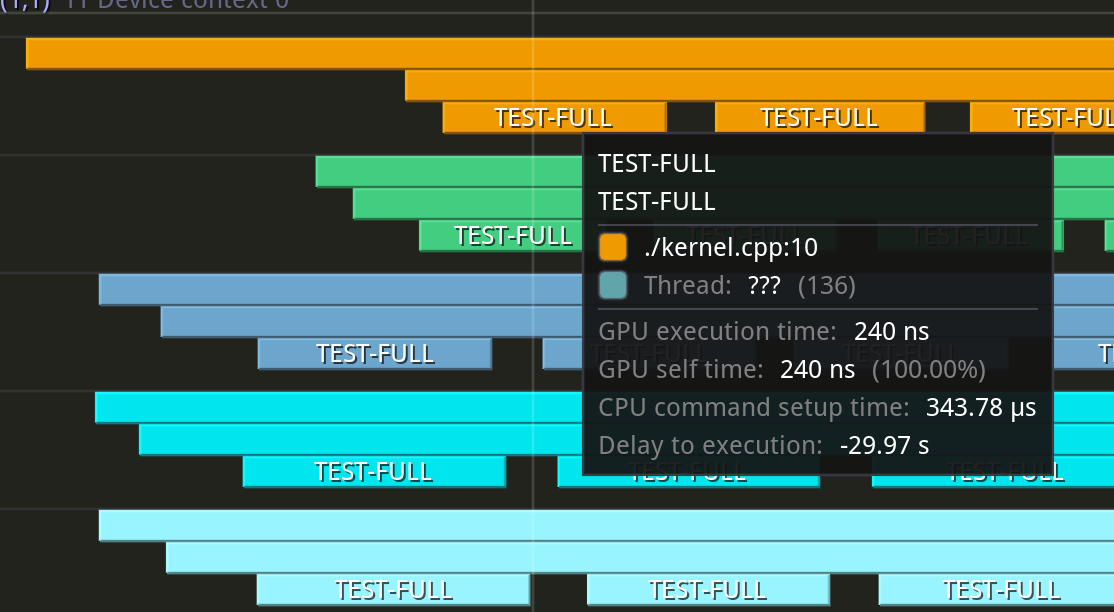
Below is couple of screenshots from tracy’s GUI, presenting the full buffer example.
Looking at one iteration of FW loop, you can see that all RISCs are reporting 125 profiled zones under their KERNEL scope.
Zooming in to the scopes, you can see single TEST-FULL zones presented in series.
Limitations
Each core has limited L1 buffer for recording device side scopes. Space for only 125 scopes is reserved.
The cycle count from RISCs on the same core are perfectly synced as they all read from the same clock counter.
The cycle counts from RISCs on different cores are closely synced with minor skews, allowing for accurate comparisons on event timestamps across cores. Note on Grayskull
tensix_resetandtt-smisoft resets will significantly worsen the skew between core clocks making core to core comparison inaccurate and wrong. Full host reboot is required for syncing core clocks if soft reset is used.The cycle counts from cores on different devices are usually not synced. Comparing times across devices requires this consideration.