Tracy Profiler
Note
Tools are only fully supported on source builds.
Overview
Tracy is an opens-source C++ profiling tool with sampling and code instrumentation profiling capabilities.
Documentation can be found here: https://github.com/wolfpld/tracy/releases/latest/download/tracy.pdf. Reading the Quick-start guide section can help with the rest of this documentation.
All host-side code, including python code, in tt_metal can be profiled using Tracy.
GUI
Tracy requires installing a desktop GUI application on local machine to view profiling results. You can view saved results and also real-time profiling data if network connectivity to the remote machine running the application is available.
Mac users can use brew to install tracy. On your terminal run:
brew uninstall tracy #Remove any old version of tracy
wget -P ~/ --no-check-certificate --no-cache --no-cookies https://raw.githubusercontent.com/tenstorrent-metal/tracy/master/tracy.rb
brew install ~/tracy.rb
rm ~/tracy.rb
Once installed run tracy GUI with:
tracy
The application will start showing a window similar to the image below.
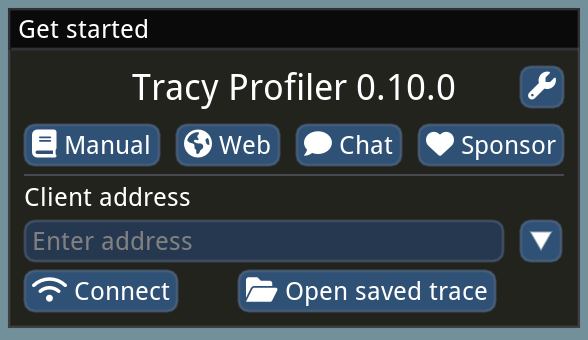
Set client address to the IP address of the remote machine, listen over port 8086 (e.g. 172.27.28.132:8086) and click connect.
“Waiting for connection …” window will pop-up after clicking connect.
Once the host machine starts running a tracy enabled application, GUI will automatically start collecting profiling data and will draw it in real time.
Profiling Host
C++
Build with the profiler option (i.e. ENABLE_TRACY=ON cmake option) is required for profiling with tracy.
build_metal.sh --enable-profiler
With this build variant, all C++ marked zones will be profiled.
Zones in Tracy are marked sections of code that users are interested in profiling. Tracy provides macros such as ZoneScoped; to accomplish this.
Please refer to section 3 of Tracy’s documentation for further information on zones and available macros.
Here is a snapshot of Tracy C++ profiling:
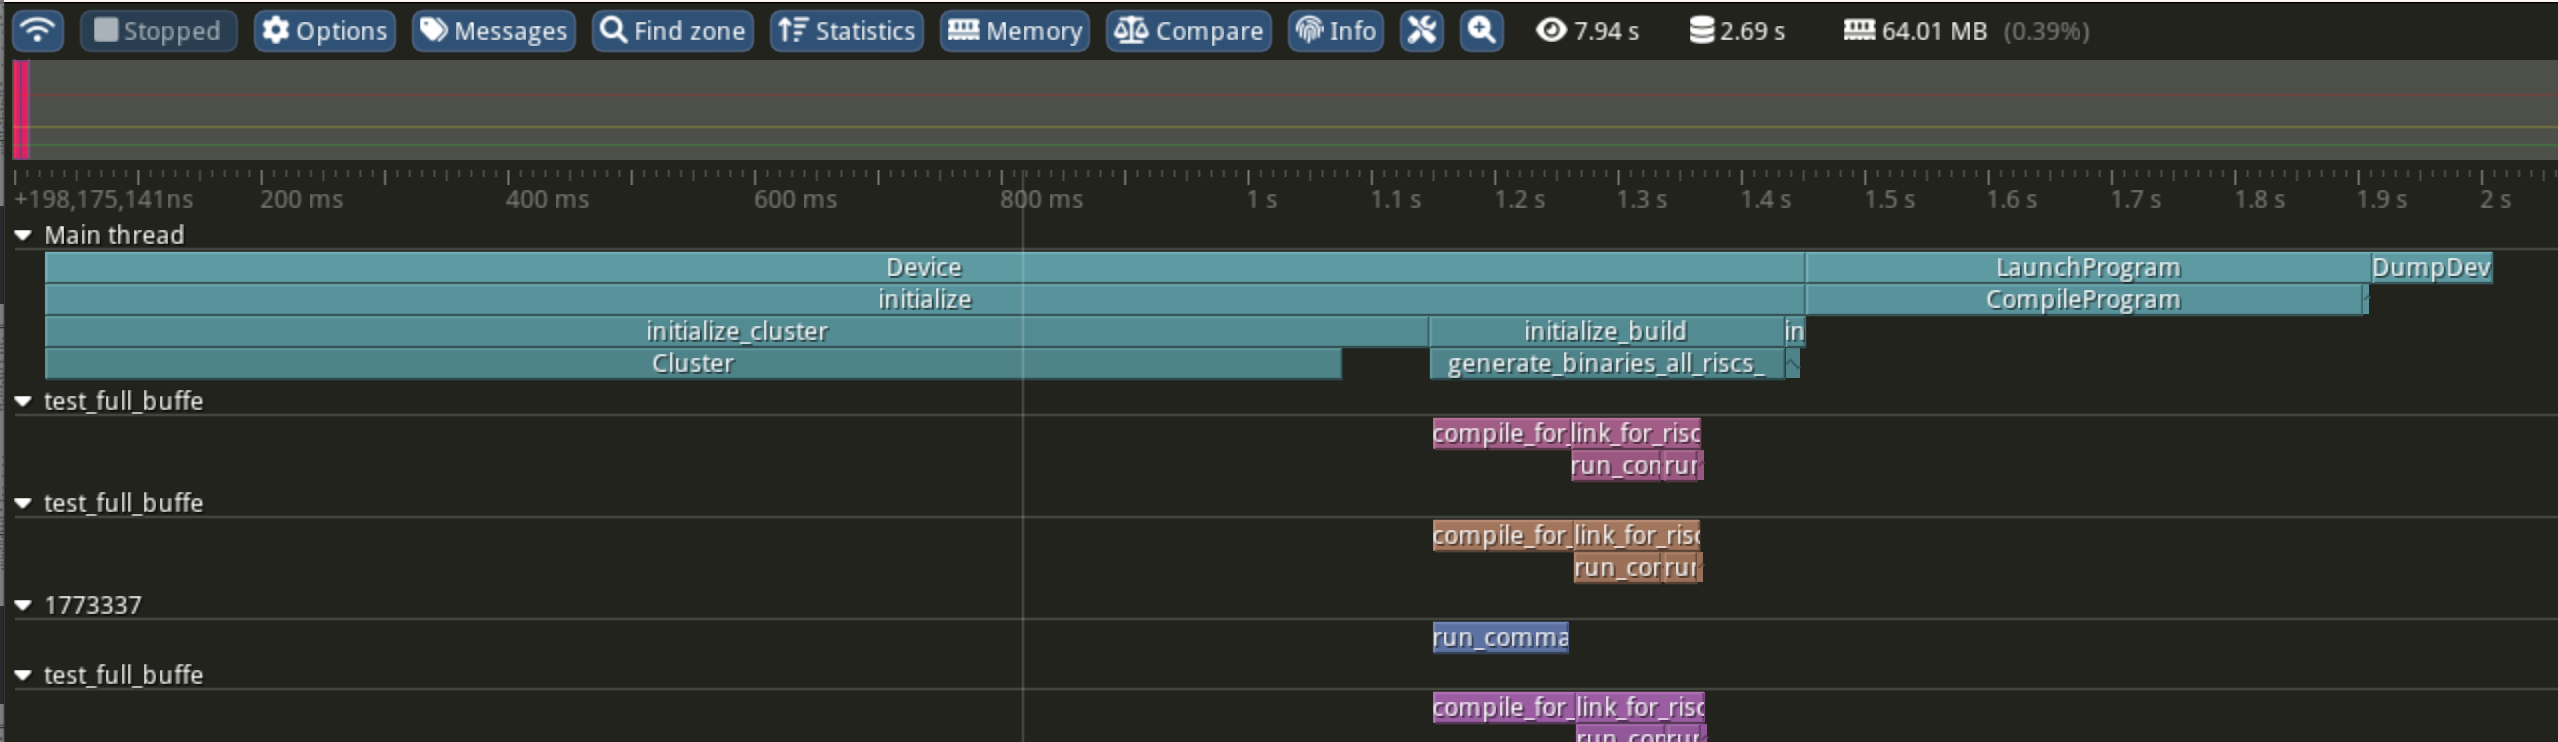
For example, the Device constructor shown above is instrumented as follows:
Device::Device(chip_id_t device_id, const std::vector<uint32_t>& l1_bank_remap) : id_(device_id)
{
    ZoneScoped;
    this->initialize(l1_bank_remap);
}
Python
Python provides sys.setprofile and sys.settrace functions as standard function for tracing and profiling python code and we use these functions to integrate python profiling with Tracy.
The following are various methods for profiling python code with tracy in the tt_metal project.
Python Scripts
Profiling python code with tracy requires running your python code with our python tracy module.
For profiling your entire python program, run your program as follows:
python -m tracy {test_script}.py
Pytest Sessions
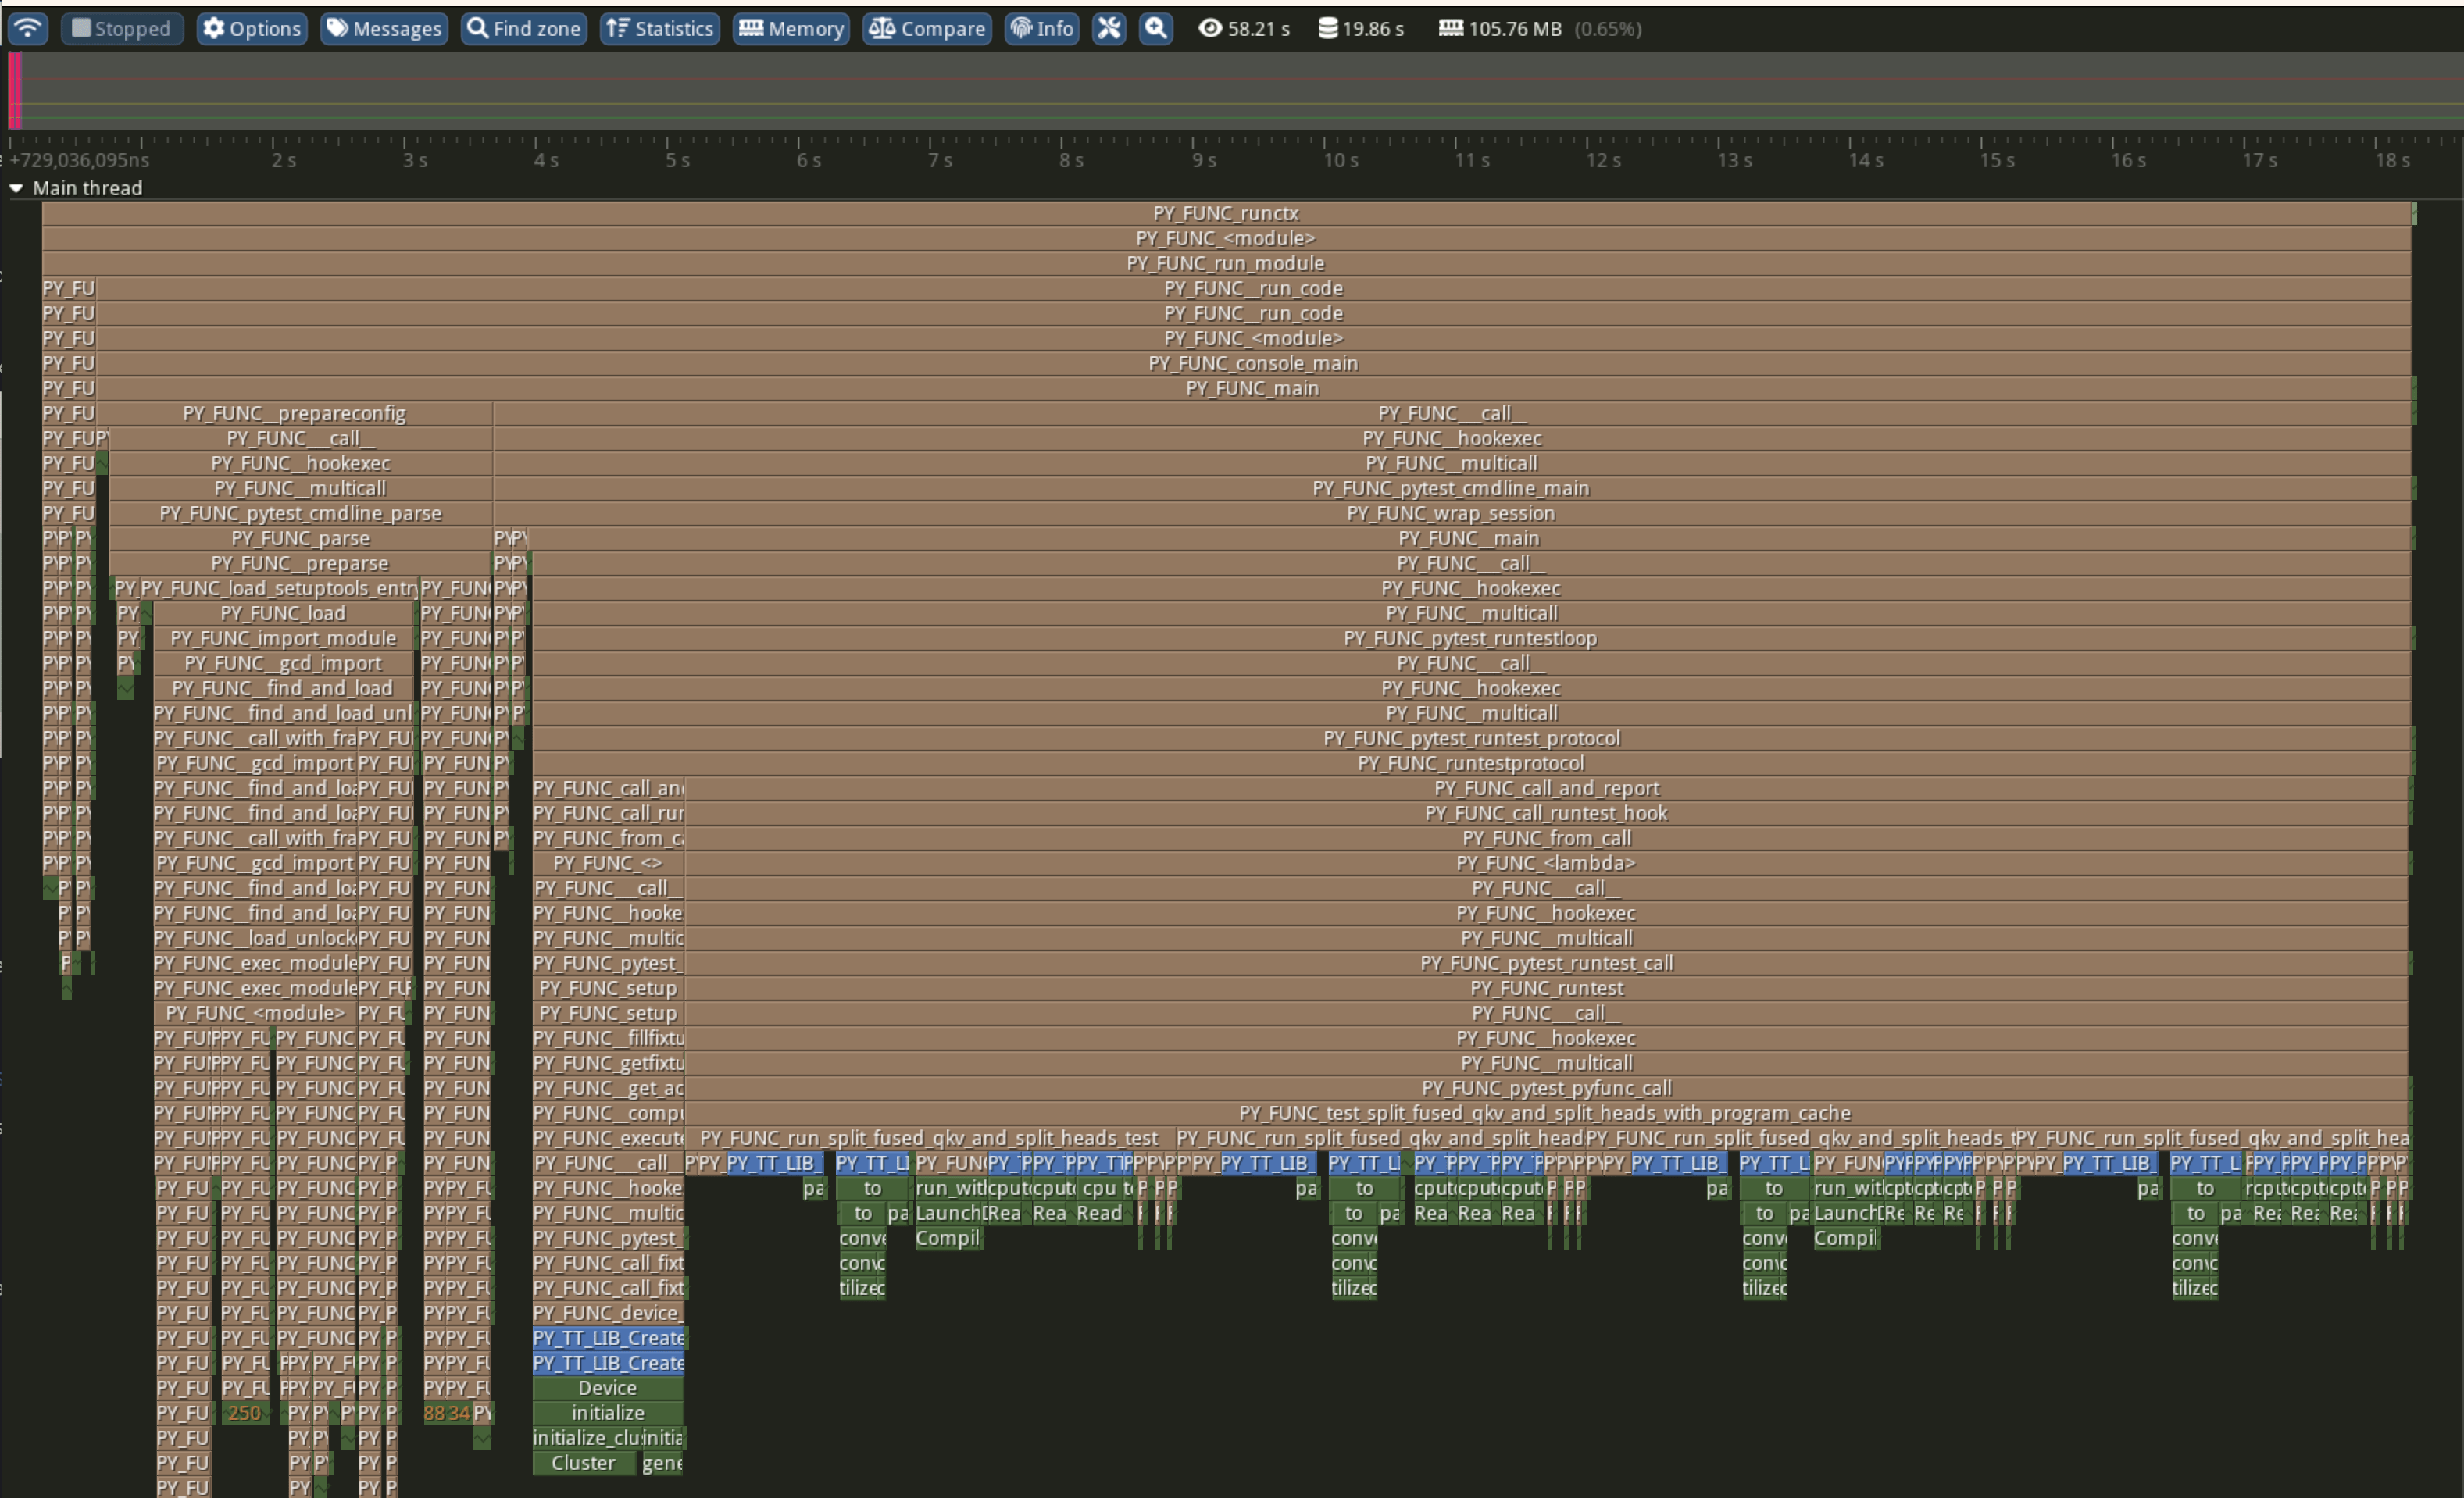
For pytest scripts you can import pytest as a module and pass its arguments accordingly. For example, to profile a BERT unit test you can run the following:
python -m tracy -m pytest models/experimental/bert_large_performant/unit_tests/test_bert_large_split_and_transform_qkv_heads.py::test_split_query_key_value_and_split_heads_with_program_cache
Instrumenting Python Code
Instrumentation can also be done without using the pytest fixture.
The following shows how to profile a function called function_under_test and all of its child python function calls by manually enabling tracy profiler.
def function_under_test():
    child_function_1()
    child_function_2()


from tracy import Profiler
profiler = Profiler()

profiler.enable()
function_under_test()
profiler.disable()
Similar to the pytest setup, calling the parent script with -p option will profile the region where profiler is enabled.
Note, it is recommended to sandwich the function call between the enable and disable calls rather than having them as first and last calls in the function being profiled.
This is because settrace and setprofile trigger on more relevant events when the setup is done previous to the function call.
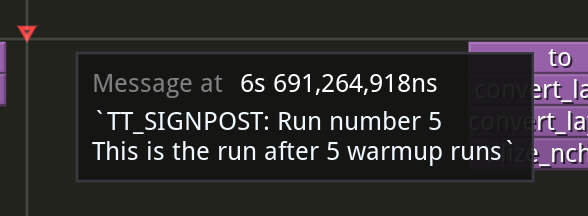
Signposts in Python Code
signpost(header, message) from the tracy module can be placed anywhere in the code path for your test. This call will produce a row in the op report CSV and a message in the tracy run.
from tracy import signpost

signpost(header="Run number 5", message="This is the run after 5 warmup runs")

run_inference()

signpost(header="Run result post proc")

post_proc()
Above example will show up as follows.
Op report CSV

Tracy run
Line-level Profiling
In some cases, significant duration of a function, does not get broken down to smaller child calls with explainable durations. This is usually either due to inline work that is
not wrapped inside a function or a call to a function that is defined as part of a shared object. For example, pytorch function calls do not come in as native python calls and will not generate python call events.
Line-level profiling is only provided with partial profiling because it produces substantially more data.
Add -l option to enable line-level profiling:
python -m tracy -p -l -m pytest models/experimental/bert_large_performant/unit_tests/test_bert_large_split_and_transform_qkv_heads.py::test_split_query_key_value_and_split_heads_with_program_cache
Profiling Device
In tracy enabled builds, device data of all active cores on devices used for the test will automatically show up.
Please refer to Device Program Profiler for more detailed overview of device side profiling with tracy.