Customize your workstation and make it truly your own
LEDs, demos, Ubuntu setup, and controlled chaos.
5 chapters · 36 min read time
LED Customization
Four chips on your desk. Each one has indicators, tiny tells of internal state. By default they sit there doing their jobs in silence, lights blinking at whatever the firmware thinks is worth reporting. You can change that.
This chapter is about making the QB2 communicate on your terms, using tt-smi to query chip state and steer the indicators toward something more informative, more decorative, or more satisfying. The machine becomes a physical dashboard.
tt-qb-lights: RGB That Responds to Your Hardware
If your QB2 is in a case with addressable RGB — or if you have a motherboard like the ASRock B850M-C with onboard RGB — there’s a ready-made solution that does this properly: tt-qb-lights, a Rust systemd service built by Taylor Singletary specifically for Tenstorrent hardware.
Rather than calling tt-smi on a loop, it reads directly from /sys/class/hwmon/blackhole-pci-* — the same kernel interface lm-sensors uses — so it’s low overhead and doesn’t depend on any Tenstorrent CLI tools being in your PATH. It talks to OpenRGB over TCP (port 6742), so any RGB device OpenRGB supports becomes a live hardware dashboard.
What it does:
- Smooth color gradients driven by ASIC temperature — cool teal at idle, cycling through your chosen palette as the chips heat up
- Power-based brightness: dims to ~30% when idle, climbs to full brightness under load
- Warning pulse: lights pulse when temperature crosses a configurable threshold (default 70°C)
- Six built-in color schemes including QuietBox Sunset (inspired by the QB2 wallpaper), TT Dark, and Tenstorrent Branding (official teal → pink → gold → red)
- Live-editable config at
~/.config/tt-qb-lights/config.toml— change schemes and restart, no rebuild needed
Quick setup:
# Clone and build
git clone https://github.com/tsingletaryTT/tt-qb-lights ~/code/tt-qb-lights
cd ~/code/tt-qb-lights

# Automated installer — checks prerequisites, builds, guides you through setup
./install.sh

# Or manually:
cargo build --release

# Test without touching your lights
./target/release/tt-qb-lights --single-shot   # prints sensor readings
./target/release/tt-qb-lights --dry-run --debug  # shows color decisions

# Initialize your config
./target/release/tt-qb-lights --init
# Then edit: nano ~/.config/tt-qb-lights/config.toml
Requires: Rust 1.70+, OpenRGB installed and running with its SDK server enabled, Tenstorrent drivers loaded (so sensors | grep blackhole shows devices).
./install.sh handles the full prerequisites check — Rust, OpenRGB, lm-sensors, build tools — and asks before installing anything. Use it on a fresh machine rather than running the steps manually.
The service file handles startup ordering so OpenRGB starts before tt-qb-lights:
sudo systemctl enable openrgb
sudo systemctl enable tt-qb-lights
sudo systemctl start tt-qb-lights
journalctl -u tt-qb-lights -f   # watch it go
Full source, architecture notes, and troubleshooting: github.com/tsingletaryTT/tt-qb-lights
Discover Your LED Options
tt-smi ships with a --help flag that reveals everything the current firmware supports. The LED interface can evolve across firmware versions, so this is the canonical starting point:
tt-smi --help | grep -i ledRun that first. Jot down the commands and flags it lists. Then explore the full help to understand flag ordering:
tt-smi --helpThe general shape of LED commands is tt-smi --set-led <device_id> <state> or similar. Firmware determines the exact vocabulary. The pattern is consistent: device ID, action, optional parameter.
Run tt-smi -s to get a JSON snapshot of all chip state before you start scripting. This gives you the live field names you’ll be parsing.
What tt-smi -s Gives You
Every 1-second pulse of tt-smi -s returns a JSON document with per-chip entries. The fields that matter for LED-driving logic:
temperature— ASIC die temperature in Celsiuscurrent— current draw in ampspower— power consumption in wattsvoltage— chip supply voltageaiclk— AI clock frequency (higher when actively computing)arc_fw_version— firmware version (important for knowing what LED commands are available)
A chip sitting idle has low aiclk. A chip running inference has elevated aiclk and rising temperature. Those two signals alone let you build a three-state indicator: idle, working, hot.
A Monitoring Script
This script reads tt-smi -s every two seconds and calls LED commands based on chip temperature. Adjust the temperature thresholds and LED command syntax to match your firmware’s actual interface (discovered via tt-smi --help):
#!/usr/bin/env python3
"""
QB2 LED monitor — drives chip indicators from tt-smi telemetry.
Reads chip temperature every 2s and sets LED state accordingly.

Temperature thresholds:
  < 60°C  → steady green (idle / normal)
  60-80°C → pulsing amber (active inference)
  > 80°C  → rapid blink red (thermal throttle zone)

LED command syntax comes from: tt-smi --help | grep -i led
Adjust LED_CMD_* below to match your firmware's actual syntax.
"""

import subprocess
import json
import time
import sys

# ── LED command templates ─────────────────────────────────────────────────────
# Fill these in from `tt-smi --help` output on your system.
# Typical shapes: tt-smi --set-led <id> on/off  OR  tt-smi led <id> <state>
LED_CMD_COOL   = "tt-smi --set-led {device_id} on"       # steady
LED_CMD_ACTIVE = "tt-smi --set-led {device_id} blink"    # slow blink
LED_CMD_HOT    = "tt-smi --set-led {device_id} blink-fast"  # fast blink

TEMP_ACTIVE_THRESHOLD = 60.0   # °C — above this = chip is working
TEMP_HOT_THRESHOLD    = 80.0   # °C — above this = thermal warning
POLL_INTERVAL_SEC     = 2.0

def get_chip_state():
    """Return list of per-chip dicts from tt-smi -s JSON output."""
    result = subprocess.run(
        ["tt-smi", "-s"],
        capture_output=True, text=True, timeout=5
    )
    if result.returncode != 0:
        return []
    try:
        data = json.loads(result.stdout)
        # tt-smi -s returns a dict with a "device_info" list (or similar)
        # Field name may vary — inspect tt-smi -s output on your machine
        return data.get("device_info", data.get("devices", []))
    except (json.JSONDecodeError, AttributeError):
        return []

def set_led(device_id: int, mode: str):
    """Drive a chip LED. mode is one of: cool, active, hot."""
    cmd_template = {
        "cool":   LED_CMD_COOL,
        "active": LED_CMD_ACTIVE,
        "hot":    LED_CMD_HOT,
    }.get(mode, LED_CMD_COOL)
    cmd = cmd_template.format(device_id=device_id)
    subprocess.run(cmd.split(), capture_output=True)

def classify(chip: dict) -> str:
    """Decide LED mode from chip telemetry dict."""
    temp = float(chip.get("temperature", 0.0))
    if temp > TEMP_HOT_THRESHOLD:
        return "hot"
    if temp > TEMP_ACTIVE_THRESHOLD:
        return "active"
    return "cool"

def main():
    print("QB2 LED monitor starting. Ctrl-C to stop.")
    prev_modes = {}
    while True:
        chips = get_chip_state()
        if not chips:
            print("  [warn] No chip data from tt-smi — is the driver loaded?",
                  file=sys.stderr)
        for i, chip in enumerate(chips):
            mode = classify(chip)
            if prev_modes.get(i) != mode:
                set_led(i, mode)
                temp = chip.get("temperature", "?")
                print(f"  chip {i}: {mode} (temp={temp}°C)")
                prev_modes[i] = mode
        time.sleep(POLL_INTERVAL_SEC)

if __name__ == "__main__":
    try:
        main()
    except KeyboardInterrupt:
        print("\nStopped.")
Save this as ~/scripts/qb2-led-monitor.py and mark it executable:
mkdir -p ~/scripts
chmod +x ~/scripts/qb2-led-monitor.py
Test it in your terminal while running a model in another session. You should see mode changes printed as the chips heat up.
Running at Boot as a User Service
Once the script works manually, make it automatic. A systemd user service starts with your login and restarts if it crashes:
mkdir -p ~/.config/systemd/userCreate ~/.config/systemd/user/qb2-led-monitor.service:
[Unit]
Description=QB2 LED Monitor
After=default.target

[Service]
ExecStart=/usr/bin/python3 /home/%i/scripts/qb2-led-monitor.py
Restart=on-failure
RestartSec=5
StandardOutput=journal
StandardError=journal

[Install]
WantedBy=default.target
Enable and start it:
# Enable lingering so user services survive logout
loginctl enable-linger $USER

# Reload systemd and start the service
systemctl --user daemon-reload
systemctl --user enable qb2-led-monitor.service
systemctl --user start qb2-led-monitor.service

# Check it's running
systemctl --user status qb2-led-monitor.service
journalctl --user -u qb2-led-monitor.service -f
The LEDs will now respond to chip state automatically, every time you log in.
Heat map across one Blackhole chip. Your LED script mirrors this in physical hardware.
The classify() function in the script is the right place to add more nuance — voltage spike detection, fan speed crossings, or any other field from tt-smi -s. The monitor loop doesn’t care what you feed it.

Next: Fun Demos →
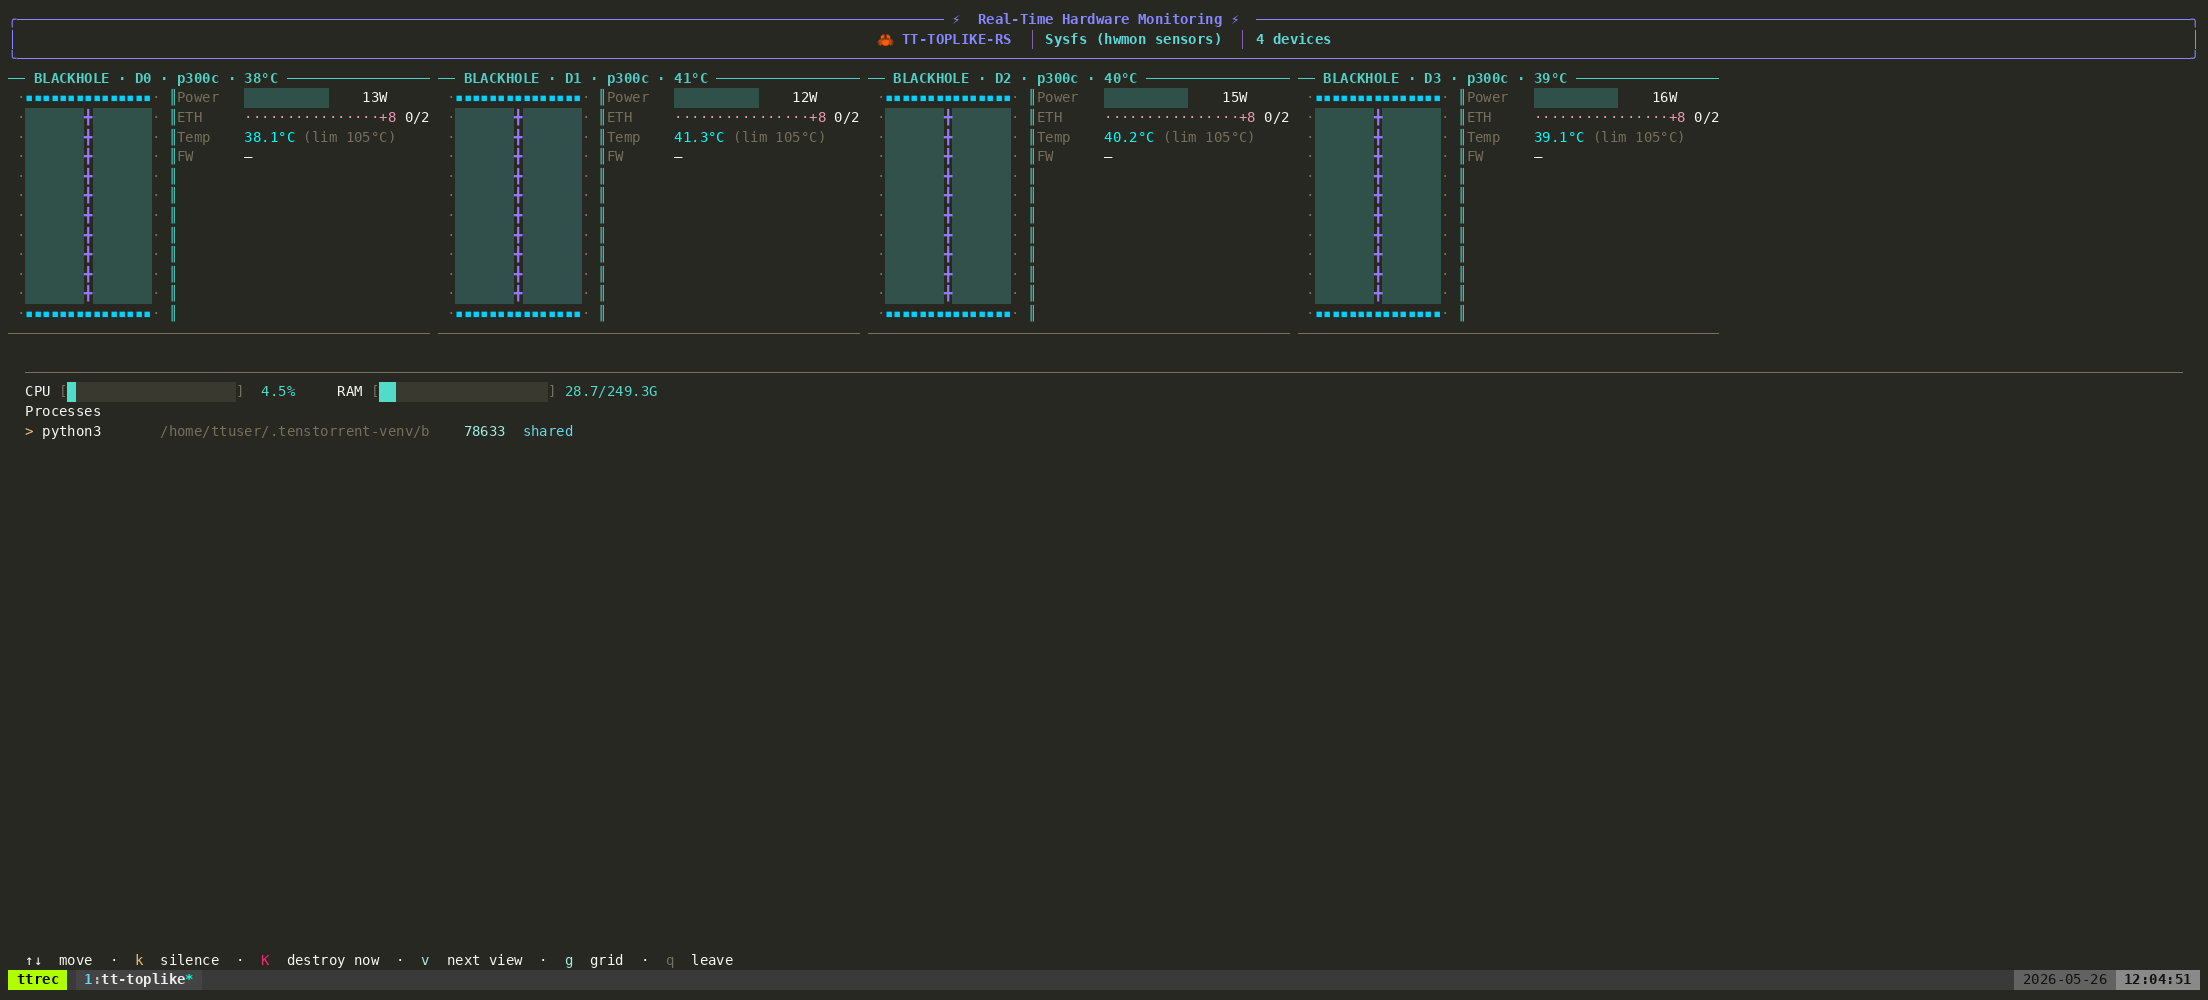
Fun Demos
There’s a specific moment that happens when someone skeptical about specialized hardware sees tt-toplike running. Their face shifts. The demos in this chapter produce that moment reliably. They’re not benchmarks. They’re invitations — to look, to question, to want to understand what the machine is actually doing.
Four demos. Each one stands alone. All of them run on your QB2 today.
Demo 1: Arcade Mode
Open a terminal. Start a model serving in another session, or just leave the hardware idle. Then run:
tt-toplike --mode arcadeThe screen fills. A hero character moves with chip telemetry — position, speed, direction all derived from actual hardware readings. AICLK frequency, power draw, thermal state. The game is the monitor. The monitor is the game.
This is the first thing to show anyone who claims hardware monitoring is inherently boring. It isn’t. It just needs better defaults.
To exit: q or Ctrl-C.
The demo lands harder when the chips are busy. Start a model in one terminal, then open arcade mode in another. The activity you see reflects real computation.
Install tt-toplike if it isn’t already present:
# tt-toplike is in the Tenstorrent apt PPA (set up by tt-installer):
sudo apt update && sudo apt install tt-toplike

# No PPA on this machine? Install the .deb from GitHub releases instead:
# https://github.com/tenstorrent/tt-toplike/releases
sudo dpkg -i tt-toplike_*.deb
# Or: cargo install tt-toplike
Demo 2: Flow Mode
Where arcade mode is expressive, flow mode is accurate-expressive. Run:
tt-toplike --mode flowParticle streams trace the NOC — Tenstorrent’s Network on Chip. During inference, data moves from the DRAM perimeter into the compute cores and back out again, each hop a real transaction on a real fabric. Flow mode makes those streams visible as animated particles.
Watch what happens when you start or stop inference. The particle density changes. The path patterns change. You’re watching the chip’s actual communication graph in motion.
This one tends to generate the most questions. “What are those things?” is how good conversations start.
Demo 3: AI Video Generation — Live Generative Art
tt-local-generator is a GTK4 desktop app that runs video generation entirely locally, no API key, no cloud dependency. The Wan2.2 text-to-video model produces 480×832 clips using all four Blackhole chips. Each clip takes roughly six minutes.
Set up a continuous generation loop and you have a generative art installation:
# Install tt-local-generator from GitHub releases (not in the Tenstorrent apt PPA)
# https://github.com/tenstorrent/tt-local-generator/releases
sudo dpkg -i tt-local-generator_*.deb

# Launch the app
tt-local-generator
In the app, open the video generation panel. Write a prompt. Let it run. The app has an “attractor mode” that generates clips continuously and plays them fullscreen. Walk away. Come back to a wall of generated cinema.
For a polished installation setup — fullscreen display, auto-start on login, continuous prompts — see the QB2 video generation lesson.
The AnimateDiff integration in tt-local-generator also runs natively on QB2. Shorter clips, different aesthetic, same local-only principle. See tt-animatediff for the standalone library.
Demo 4: Local 70B with No Internet Required
Four chips. A language model with 70 billion parameters. No API key. No latency spike from a datacenter on another continent.
The fastest path is through tt-inference-server, which handles the Docker container and weight caching automatically:
docker run \
  --env "HF_TOKEN=$HF_TOKEN" \
  --ipc host \
  --publish 8000:8000 \
  --device /dev/tenstorrent \
  --mount type=bind,src=/dev/hugepages-1G,dst=/dev/hugepages-1G \
  --volume volume_id_Llama-3.3-70B-Instruct:/home/container_app_user/cache_root \
  ghcr.io/tenstorrent/tt-inference-server/vllm-tt-metal-src-release-ubuntu-22.04-amd64:0.10.1-555f240-22be241 \
  --model Llama-3.3-70B-Instruct \
  --tt-device p300x2
Wait for Application startup complete — first run downloads 140 GB of weights, so plan ahead. Then ask it something that requires reasoning:
curl -s http://localhost:8000/v1/chat/completions \
  -H "Content-Type: application/json" \
  -d '{
    "model": "Llama-3.3-70B-Instruct",
    "messages": [{"role": "user", "content": "Explain the tradeoffs between data-parallel and model-parallel inference for large language models. Be specific about memory and latency."}]
  }' | python3 -c "import json,sys; d=json.load(sys.stdin); print(d['choices'][0]['message']['content'])"
The response comes from silicon in your own office. The model that required a specialized cloud service a year ago runs on hardware you own.
That’s the demo.
For the full walkthrough — prerequisites, HuggingFace token setup, the DeepSeek reasoning model variant, and troubleshooting — see Running Llama-3.3-70B on QB2.
One Blackhole chip running a slice of Llama-3.1-70B. All four of yours look like this, simultaneously.

Demo 5: TT-Forge Compiletron — Hunt the Wild Model
The premise is simple: compile as many models as possible, score points, and try not to hit something that crashes the runtime.
tt-forge-compiletron is a roguelike model compilation game. It is also a genuine engineering survey tool. The gameplay loop runs models from the tt-forge-models zoo (200+ curated PyTorch and JAX models) through forge.compile() on your Blackhole chips. Each successful compile earns points. First-ever compile of a model earns a ×5 multiplier. The scoring system rewards breadth, rarity, and speed.
The TUI is three screens running in a Textual interface: a model queue on the left, live per-chip compilation status in the center, and a running scoreboard with ASCII art banners rendered in pyfiglet. When a model compiles successfully, the First Voice feature kicks in — a themed inference pass that prints the model’s first decoded output on Tenstorrent silicon. The first time a language model generates a token on your hardware, it announces itself with a banner.
The bestiary at data/bestiary.json grows with every session. It records compile status, timing, and failure class for every model attempted. Come back later and it knows what you’ve already conquered.
Set up and launch:
cd ~/code/tt-forge-compiletron
source ~/tt-forge-fe/env/activate
python3 expedition.py run --tui --seed-only --limit 8 --chips 4
--seed-only pulls from the curated zoo only, --limit 8 caps the session at eight models, --chips 4 assigns all four Blackhole cards. A good starting session.
First Voice is the payoff. After each successful compile, the game runs one inference pass and prints the model’s decoded output. A sentiment classifier labeling its first sentence. A ResNet identifying its first image. A GPT-2 generating its first token. Watch the chip do something real with what it just learned to run.
Four genuine Blackhole chips across two p300c cards, joined by the Samtec link. The model-zoo game compiles a different model on each, in parallel.
Next: Ubuntu Customization →
Ubuntu Customization
The QB2 ships with Ubuntu 24.04 LTS and its stock GNOME desktop — the same experience every Ubuntu user gets. It’s functional. It’s also waiting for your preferences. This chapter is about making the machine yours without breaking what Tenstorrent set up.
The rule throughout: don’t touch the tt-metal environments. Customize everything else freely.
Quick Orientation
Ubuntu 24.04 uses apt as its system package manager, with the GNOME desktop on top. Three package systems coexist:
apt         # system packages — drivers, libraries, system tools
snap        # containerized apps — VS Code, browser
flatpak     # alternative sandbox format (install if needed)
Check available storage before installing anything heavy:
ncdu ~/Install ncdu first if it isn’t present: sudo apt install ncdu. It’s a terminal disk usage navigator. Run it before downloading model weights too — Llama-3.1-70B is 140 GB. Surprises are unpleasant.
Do not run sudo apt upgrade without checking tt-metal kernel compatibility first. Tenstorrent drivers are kernel-version-sensitive. An automatic kernel upgrade can make your chips temporarily invisible until you reload the driver. Check the tt-metal release notes for the current supported kernel range before any major upgrade.
Desktop
Ubuntu’s GNOME desktop is what greets you on first boot. Two tools make it yours without fighting it:
GNOME Tweaks — fonts, window-button layout, animations, startup apps:
sudo apt install gnome-tweaksExtension Manager — browse and install GNOME Shell extensions (dash-to-dock, system monitors, clipboard history):
sudo apt install gnome-shell-extension-managerMost desktop settings live in dconf; script them with gsettings:
gsettings set org.gnome.desktop.interface color-scheme prefer-dark   # dark mode
gsettings set org.gnome.desktop.interface clock-show-seconds true
GNOME on Ubuntu 24.04 runs on Wayland by default — echo $XDG_SESSION_TYPE confirms it. That matters when you pick a terminal below.
Prefer KDE? GNOME is the default everyone gets, but it’s only a default — you can run KDE Plasma instead if that’s more your taste (it’s where this guide’s author does most of their own work):
sudo apt install kde-plasma-desktopIt installs alongside GNOME; pick the session from the gear menu on the login screen. More knobs, heavier footprint, entirely optional.
Terminal
Ubuntu’s GNOME desktop ships GNOME Terminal by default. It’s perfectly good. If you want more, a few favorites:
Kitty — GPU-accelerated, fast, tabs + splits built in:
sudo apt install kittyFoot — minimal native Wayland terminal, fastest startup:
sudo apt install footAlacritty — cross-platform, GPU-rendered, config-file-driven:
sudo apt install alacrittyAny of these pairs well with the rest of this setup.
Shell
The system shell is bash. Two popular upgrades:
zsh + starship prompt — zsh is feature-rich; starship is a fast, cross-shell prompt that shows git status, Python venv, and more:
sudo apt install zsh
chsh -s $(which zsh)   # set zsh as your login shell

# Install starship (Rust binary, no system package needed)
curl -sS https://starship.rs/install.sh | sh

# Add to your ~/.zshrc:
echo 'eval "$(starship init zsh)"' >> ~/.zshrc
fish — if you want a shell that just works out of the box with autosuggestions and syntax highlighting:
sudo apt install fish
chsh -s $(which fish)
Log out and back in after chsh for the new shell to take effect in all sessions.
Useful CLI Tools
These are collectively small downloads, collectively large quality-of-life gains:
sudo apt install \
  htop \       # interactive process monitor
  ncdu \       # disk usage navigator
  bat \        # cat with syntax highlighting
  ripgrep \    # blazing grep replacement (rg)
  fd-find \    # fast find replacement (fd)
  fzf \        # fuzzy finder — attach to shell history, file browsing
  jq \         # JSON processor — useful for tt-smi -s output
  tmux         # terminal multiplexer — see below
fzf in particular integrates with shell history (Ctrl-R) and file search (Ctrl-T) to make terminal navigation dramatically faster. Add these lines to your .bashrc or .zshrc after installing:
eval "$(fzf --bash)"    # bash
# or
eval "$(fzf --zsh)"     # zsh
tmux for Multi-Session Work
When you’re downloading a 140 GB model in one session, monitoring chips in another, and editing code in a third, tmux prevents terminal chaos. It also keeps processes running if your SSH connection or terminal emulator drops.
# Install
sudo apt install tmux

# Start a new named session
tmux new -s qb2

# Attach to an existing session
tmux attach -t qb2

# Key bindings (default prefix is Ctrl-b):
#   Ctrl-b c     new window
#   Ctrl-b %     vertical split
#   Ctrl-b "     horizontal split
#   Ctrl-b d     detach (session keeps running)
#   Ctrl-b [     scroll mode (q to exit)
A minimal ~/.tmux.conf to add mouse support and increase scrollback:
cat >> ~/.tmux.conf << 'EOF'
set -g mouse on
set -g history-limit 50000
set -g default-terminal "tmux-256color"
EOF
Python Environment Management
Ubuntu 24.04’s system Python is externally-managed. pip install at the system level will refuse or break things. This is correct behavior. Don’t fight it.
For managing Python versions and creating isolated envs outside the tt-metal stack, use uv — it’s fast, correct, and doesn’t require a conda installation:
# Install uv
curl -LsSf https://astral.sh/uv/install.sh | sh

# Create a project-local Python 3.11 env
uv venv --python 3.11 .venv
source .venv/bin/activate

# Install packages into it
uv pip install numpy requests
Alternatively, pyenv for managing multiple Python versions:
curl https://pyenv.run | bash
# Add to shell init (follow the printed instructions)
pyenv install 3.11.9
pyenv virtualenv 3.11.9 myproject
pyenv activate myproject
Keep these entirely separate from ~/tt-metal/python_env/ and ~/.tenstorrent-venv/. Those are managed environments. Don’t pip-install into them manually.
VS Code
sudo snap install code --classicOr download the .deb from code.visualstudio.com for a non-snap install if you prefer:
sudo dpkg -i code_*.debOnce VS Code is installed, get the Tenstorrent extension from the marketplace. Search for “tt-vscode-toolkit” in the Extensions panel, or install from the command line:
code --install-extension tenstorrent.tt-vscode-toolkitThe extension adds tt-metal project support, TTNN kernel highlighting, chip status indicators in the status bar, and guided lessons — including the QB2 video generation walkthrough.
Useful Aliases
Add these to ~/.bashrc or ~/.zshrc to cut down repetitive typing:
# Tenstorrent environment shortcuts
alias ttenv='source ~/tt-metal/python_env/bin/activate'
alias ttvllm='source ~/.tenstorrent-venv/bin/activate'

# Readable tt-smi JSON output
alias ttsmi='tt-smi -s | python3 -m json.tool'

# Watch chip state every 2 seconds
alias ttwatch='watch -n2 "tt-smi -s | python3 -m json.tool"'

# Quick disk check
alias diskcheck='ncdu ~/ --exclude ~/models'
Source the file to pick up changes immediately:
source ~/.bashrcBreaking & Fixing Things
The QB2 is a workstation, not a cloud VM with a reset button in a web console. Software changes are reversible. Hardware is physically robust. The worst case scenario for almost everything in this chapter is a few minutes of diagnostic work and a single command.
This philosophy matters. It means you should experiment freely. Break things. Learn the recovery pattern. The machine can take it.
tt-smi is the first diagnostic for anything chip-related. Before filing a bug or posting to Discord, run tt-smi -s and include the JSON output. It answers half the questions before they’re asked.
The Recovery Ladder
Before reaching for dramatic solutions, follow this order:
- Run the failing command again (transient errors happen)
- Check the relevant log:
journalctl,docker logs, or the service’s own log file - Restart the failing service:
systemctl restart <name>ordocker restart <container> - Reload the driver:
sudo modprobe -r tenstorrent && sudo modprobe tenstorrent - Reboot:
sudo reboot - Post to the Tenstorrent Discord with
tt-smi -soutput
The vast majority of issues resolve at step 1, 2, or 3.
Common Breakage Patterns
1. pip install in the Wrong Environment
Symptom: Something installed correctly but broke an import in tt-metal, or pip install warned about an externally-managed environment.
Cause: Installing into system Python, or into a tt-metal venv that shouldn’t be modified.
Fix:
# Identify which pip you used
which pip   # or: which pip3

# If it was system pip, uninstall the conflicting package
pip uninstall <package-name>

# If you modified a tt-metal venv, recreate it:
# First, note the requirements file for that venv, then:
rm -rf ~/tt-metal/python_env
# Re-run the tt-metal environment setup script
# (check ~/tt-metal/README.md for the exact command)
Going forward, always activate a project-specific venv before installing packages. Never use pip install --break-system-packages unless you have a specific reason.
2. conda Conflict with tt-metal
Symptom: Conda activated, model fails to load, TTNN throws import errors about library version mismatches.
Cause: Conda replaces system libraries in PATH, breaking tt-metal’s pinned dependencies.
Fix:
# Deactivate conda
conda deactivate

# Remove conda from PATH for this session
unset CONDA_DEFAULT_ENV

# Long-term: add this to your .bashrc AFTER the conda init block
# to prevent auto-activation:
conda config --set auto_activate_base false
Keep tt-metal environments and conda environments in separate shell sessions. They do not coexist gracefully.
3. “No Devices Found” After a Kernel Upgrade
Symptom: tt-smi returns no devices. lsmod | grep tenstorrent shows nothing.
Cause: A kernel upgrade installed a new kernel without re-building or loading the Tenstorrent driver for it.
Fix:
# Check if the driver module exists for the current kernel
ls /lib/modules/$(uname -r)/extra/ | grep tenstorrent

# If missing, reinstall the tt-metal driver package
sudo apt install --reinstall tt-firmware   # adjust package name as needed
# or re-run the tt-installer if you used that for initial setup

# Reload the driver
sudo modprobe tenstorrent

# Verify
tt-smi -s
If sudo modprobe tenstorrent fails with “module not found”, the driver isn’t built for the current kernel. You need to either roll back the kernel or rebuild the driver. Check the tt-metal GitHub for the currently supported kernel range.
4. Model Download Corrupted Mid-Way
Symptom: Model fails to load. Error messages about unexpected EOF or missing shards.
Fix:
# The Hugging Face CLI supports resumable downloads
huggingface-cli download <model-id> \
  --local-dir ~/models/<model-name> \
  --resume-download

# Example for Llama-3.1-8B:
huggingface-cli download meta-llama/Llama-3.1-8B-Instruct \
  --local-dir ~/models/Llama-3.1-8B-Instruct \
  --resume-download
If the download is severely corrupted, delete the partial directory and start fresh:
rm -rf ~/models/<model-name>
huggingface-cli download <model-id> --local-dir ~/models/<model-name>
5. OOM During Inference
Symptom: Python process crashes with out-of-memory error during model load or inference. The model may be too large for the chip DRAM, or you’re only using one chip for a model that needs four.
Fix:
# Verify you're using all four chips for large models
python3 -m vllm.entrypoints.openai.api_server \
  --model ~/models/Llama-3.1-70B-Instruct \
  --num_gpus 4 \           # this is required for 70B
  --port 8000

# For a smaller model that fits on fewer chips
python3 -m vllm.entrypoints.openai.api_server \
  --model ~/models/Qwen3-0.6B \
  --num_gpus 1 \
  --port 8000
Also check that no other process is holding chip memory:
tt-smi -s | python3 -c "
import json, sys
d = json.load(sys.stdin)
for chip in d.get('device_info', []):
    print(chip.get('board_id', '?'), '— mem used:', chip.get('dram_usage', '?'))
"
6. Docker or tt-inference-server Won’t Start
Symptom: docker ps hangs or errors; tt-inference-server container fails to launch.
tt-installer v3.2.0+ installs Docker by default. If you chose Podman instead (
--install-container-runtime=podman), substitutepodmanfordockerin the commands below.
Fix:
# Check if Docker daemon is running
systemctl status docker

# Start it if not
sudo systemctl start docker

# Check running containers
docker ps -a

# View logs from the last failed container
docker logs $(docker ps -a -q --filter "status=exited" | head -1)

# Hard-restart a specific container
docker stop <container-name> && docker start <container-name>

# If the container is corrupted, remove and repull
docker rm <container-name>
docker pull <image-name>
# Then re-run the server start command
7. tt-toplike Crashes at Startup
Symptom: tt-toplike exits immediately or produces a panic/error message.
Cause: Almost always a driver issue — tt-toplike can’t see the chips.
Fix:
# Verify chips are visible first
tt-smi -s

# If tt-smi also fails, reload the driver
sudo modprobe -r tenstorrent
sudo modprobe tenstorrent
tt-smi -s   # should now show four devices

# Then retry
tt-toplike --mode normal
If tt-smi -s works but tt-toplike still fails, reinstall it:
# tt-toplike is in the Tenstorrent apt PPA (set up by tt-installer):
sudo apt update && sudo apt install --reinstall tt-toplike

# No PPA on this machine? Install the .deb from GitHub releases instead:
# https://github.com/tenstorrent/tt-toplike/releases
sudo dpkg -i tt-toplike_*.deb
# Or: cargo install tt-toplike --force
The tenstorrent kernel module is a loadable driver. If it was loaded for kernel 6.x.y and you’re now on 6.x.z, it may need to be rebuilt or reinstalled. dmesg | grep tenstorrent is your friend here — it shows exactly why the module failed to load.
Community & Contribution
The hardware is interesting alone. It becomes more interesting when someone else’s kernel runs on it, or when your demo helps someone else understand what’s possible.
This chapter is about where to find those people and how to add to what they’re building.
tt-awesome
The community catalog lives at tenstorrent.github.io/tt-awesome. Models, demos, integrations, experiments — contributed by people who picked up the same hardware you have and built something worth sharing. Browse it before building. Someone may have already done the hard part, and their version might be better than yours would be.
Adding a project is a pull request to github.com/tenstorrent/tt-awesome. The bar is low: working code, a README, and a description that tells someone why they’d want to run it.
GitHub
All of Tenstorrent’s core repositories are public: github.com/tenstorrent.
Useful starting points:
- tt-metal — the core compute stack; file bugs for driver issues, TTNN problems, compilation failures
- tt-smi — hardware monitoring; file bugs for incorrect readings, missing devices, command errors
- tt-toplike — the TUI visualizer; file bugs for crashes, rendering issues, wrong telemetry
- tt-animatediff — community-ready video generation library: github.com/tenstorrent/tt-animatediff, v0.1.0
When filing a bug, include tt-smi -s output and your Ubuntu/kernel versions. A reproducer is worth ten paragraphs of description.
Discord
The Tenstorrent Discord is the fastest path to a human answer. Find the link at tenstorrent.com/community. The community includes Tenstorrent engineers, researchers running production workloads, and people who are a week into their first QB2, exactly where you were recently.
The channels worth knowing: #hardware-support for driver and chip questions, #tt-metal for software stack questions, #show-and-tell for demos. Show your tt-toplike screenshots there. People appreciate them.
Contribution Ideas
Add a demo to tt-awesome. If you’ve got something running on your QB2 that took more than an hour to figure out, it’s worth sharing. A Jupyter notebook demonstrating a novel TTNN op, a generative art setup using tt-local-generator, a custom LED monitoring script — these are all valid contributions.
Share a VHS recording. A terminal recording of your demo is worth more than a static screenshot. VHS renders .tape files into .gif or .mp4. Record your tt-toplike flow mode demo, your first 70B query, your LED script responding to thermal changes. Share to Discord or embed in a tt-awesome entry.
Write a lesson. The tt-vscode-toolkit lessons are written by people who built things and wanted to teach them. If you’ve worked through a non-trivial workflow on QB2, the lesson format is a good home for it.
File a bug. When something breaks and you fix it, the issue report benefits the next person. Document the exact error message, the kernel version, the fix. The break-and-fix patterns in this guide grew from exactly that kind of contribution.
The most useful bug reports include a tt-smi -s JSON snapshot, the full error output, and the exact sequence of commands that triggered the issue. Reproducers matter more than explanations.
Where to Go from Here
You’ve tinkered. You’ve broken things and fixed them. You’ve shown demos that stopped people mid-conversation. The next layer is the Tinker track, where the interesting question shifts from “what can this machine do?” to “what can I build on it?”
The QB2 becomes more interesting the more people are working on it together. The hardware is the same machine in every office. The software, the experiments, the failures-turned-blog-posts, the demos running on Discord at midnight — those are what actually make a platform. You’re part of that now. Build something.