Overview
The Mandelbrot set is a fractal defined by the iterative equation z = z² + c. Points that don't diverge to infinity belong to the set. This project demonstrates GPU-style parallel computation on TT hardware.
Features:
- High-resolution fractal rendering
- Interactive zoom and pan
- Color mapping for iteration counts
- Performance profiling
Why This Project:
- ✅ Embarrassingly parallel (perfect for tiles)
- ✅ Beautiful visual output
- ✅ Teaches performance optimization
- ✅ Complex number operations
Time: 30 minutes | Difficulty: Beginner-Intermediate
Example Output
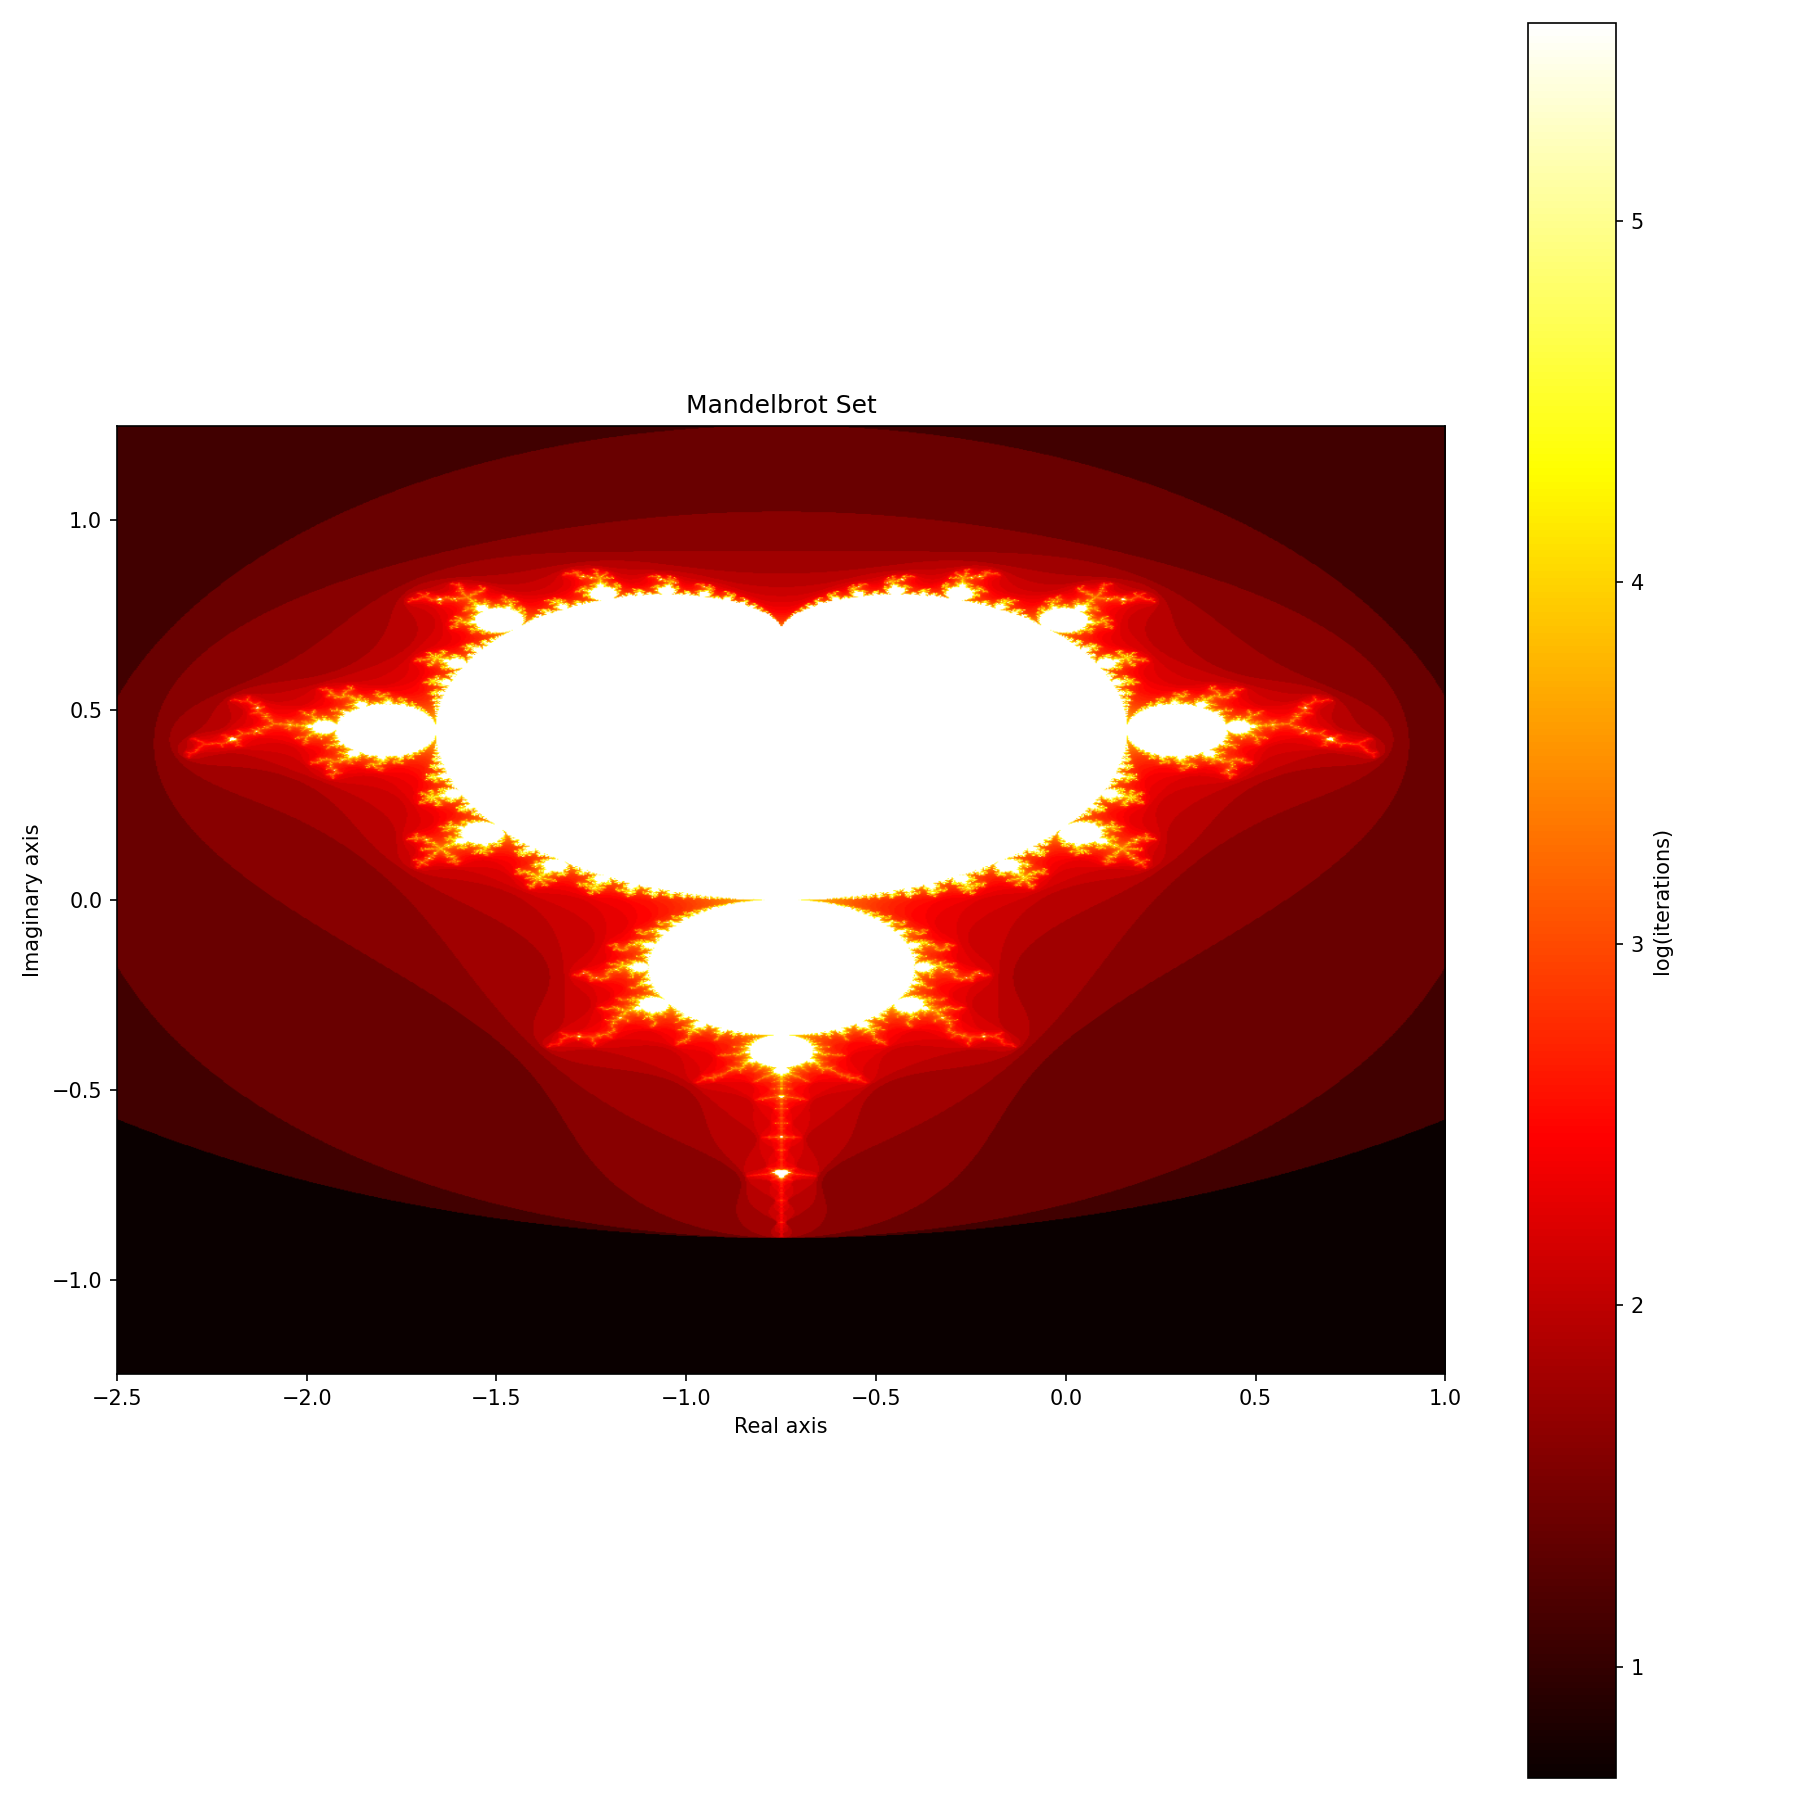
Full Mandelbrot set rendered at 2048x2048 resolution on TT hardware. The intricate fractal patterns emerge from the simple equation z = z² + c.
Deploy the Project
📦 Deploy All Cookbook Projects
This creates the project in ~/tt-scratchpad/cookbook/mandelbrot/.
Implementation
Step 1: Core Renderer (renderer.py)
"""
Mandelbrot Set renderer using TTNN
Each pixel computed independently - ideal for parallel execution
"""

import ttnn
import torch
import numpy as np
import time

class MandelbrotRenderer:
    def __init__(self, device):
        """
        Initialize Mandelbrot renderer.

        Args:
            device: TTNN device handle
        """
        self.device = device

    def render(self, width, height, x_min, x_max, y_min, y_max, max_iter=256):
        """
        Render Mandelbrot set for given complex plane region.

        Algorithm:
        For each pixel (representing complex number c):
            z = 0
            for i in range(max_iter):
                z = z² + c
                if |z| > 2:
                    return i  (iteration count)
            return max_iter  (in set)

        Args:
            width, height: Image dimensions
            x_min, x_max: Real axis range
            y_min, y_max: Imaginary axis range
            max_iter: Maximum iterations before considering point "in set"

        Returns:
            2D array of iteration counts
        """
        print(f"Rendering {width}×{height} image...")
        print(f"Complex plane: [{x_min}, {x_max}] × [{y_min}, {y_max}]i")
        print(f"Max iterations: {max_iter}")

        start_time = time.time()

        # Create coordinate grids
        x = torch.linspace(x_min, x_max, width, dtype=torch.float32)
        y = torch.linspace(y_min, y_max, height, dtype=torch.float32)

        # Meshgrid for complex plane
        X, Y = torch.meshgrid(x, y, indexing='xy')
        C_real = X.T  # Transpose to match image coordinates
        C_imag = Y.T

        # Move to device
        c_real = ttnn.from_torch(C_real, device=self.device, layout=ttnn.TILE_LAYOUT)
        c_imag = ttnn.from_torch(C_imag, device=self.device, layout=ttnn.TILE_LAYOUT)

        # Initialize z = 0
        z_real = ttnn.zeros_like(c_real)
        z_imag = ttnn.zeros_like(c_imag)

        # Iteration counter (starts at max_iter, decremented when diverged)
        iterations = ttnn.full_like(c_real, max_iter)

        # Iterate z = z² + c
        for i in range(max_iter):
            # Complex multiplication: (a + bi)² = (a² - b²) + (2ab)i
            z_real_sq = ttnn.square(z_real)
            z_imag_sq = ttnn.square(z_imag)

            z_real_new = ttnn.subtract(z_real_sq, z_imag_sq)
            z_real_new = ttnn.add(z_real_new, c_real)

            z_imag_new = ttnn.multiply(z_real, z_imag)
            z_imag_new = ttnn.multiply(z_imag_new, 2.0)
            z_imag_new = ttnn.add(z_imag_new, c_imag)

            # Magnitude: |z| = sqrt(real² + imag²)
            magnitude_sq = ttnn.add(z_real_sq, z_imag_sq)

            # Mark diverged points (|z| > 2, so |z|² > 4)
            diverged = ttnn.gt(magnitude_sq, 4.0)

            # Update iteration count (only for points that just diverged)
            still_iterating = ttnn.eq(iterations, max_iter)
            just_diverged = ttnn.logical_and(diverged, still_iterating)

            # Set iteration count to current iteration
            iterations = ttnn.where(just_diverged, float(i), iterations)

            # Update z for next iteration
            z_real = z_real_new
            z_imag = z_imag_new

            # Early exit if all points diverged
            if i % 10 == 0:  # Check every 10 iterations
                num_still_iterating = ttnn.sum(still_iterating)
                if ttnn.to_torch(num_still_iterating).item() == 0:
                    print(f"All points diverged by iteration {i}")
                    break

        # Convert to numpy
        result = ttnn.to_torch(iterations).cpu().numpy()

        elapsed = time.time() - start_time
        pixels_per_sec = (width * height) / elapsed
        print(f"Rendered in {elapsed:.2f}s ({pixels_per_sec/1e6:.2f} Mpixels/sec)")

        return result

    def render_julia(self, width, height, c_real, c_imag, x_min=-2, x_max=2,
                     y_min=-2, y_max=2, max_iter=256):
        """
        Render Julia set for fixed c (vs Mandelbrot which varies c).

        Julia set: z₀ = pixel coordinate, fixed c, iterate z = z² + c

        Args:
            width, height: Image dimensions
            c_real, c_imag: Fixed complex parameter
            x_min, x_max, y_min, y_max: Coordinate range
            max_iter: Maximum iterations

        Returns:
            2D array of iteration counts
        """
        print(f"Rendering Julia set with c = {c_real} + {c_imag}i")

        # Create initial z (pixel coordinates)
        x = torch.linspace(x_min, x_max, width, dtype=torch.float32)
        y = torch.linspace(y_min, y_max, height, dtype=torch.float32)
        X, Y = torch.meshgrid(x, y, indexing='xy')

        z_real = ttnn.from_torch(X.T, device=self.device, layout=ttnn.TILE_LAYOUT)
        z_imag = ttnn.from_torch(Y.T, device=self.device, layout=ttnn.TILE_LAYOUT)

        # Fixed c
        c_r = ttnn.full_like(z_real, c_real)
        c_i = ttnn.full_like(z_imag, c_imag)

        # Iterate (same as Mandelbrot)
        iterations = ttnn.full_like(z_real, max_iter)

        for i in range(max_iter):
            z_real_sq = ttnn.square(z_real)
            z_imag_sq = ttnn.square(z_imag)

            z_real_new = ttnn.add(ttnn.subtract(z_real_sq, z_imag_sq), c_r)
            z_imag_new = ttnn.add(ttnn.multiply(ttnn.multiply(z_real, z_imag), 2.0), c_i)

            magnitude_sq = ttnn.add(z_real_sq, z_imag_sq)
            diverged = ttnn.gt(magnitude_sq, 4.0)

            still_iterating = ttnn.eq(iterations, max_iter)
            just_diverged = ttnn.logical_and(diverged, still_iterating)

            iterations = ttnn.where(just_diverged, float(i), iterations)

            z_real = z_real_new
            z_imag = z_imag_new

        return ttnn.to_torch(iterations).cpu().numpy()


# Example usage
if __name__ == "__main__":
    import ttnn
    from explorer import MandelbrotVisualizer

    device = ttnn.open_device(device_id=0)
    renderer = MandelbrotRenderer(device)

    # Classic Mandelbrot view
    mandelbrot = renderer.render(
        width=2048, height=2048,
        x_min=-2.5, x_max=1.0,
        y_min=-1.25, y_max=1.25,
        max_iter=512
    )

    # Visualize
    viz = MandelbrotVisualizer(renderer)
    viz.show(mandelbrot)

    ttnn.close_device(device)
Step 2: Interactive Explorer (explorer.py)
"""
Interactive Mandelbrot explorer with zoom and pan
"""

import numpy as np
import matplotlib.pyplot as plt
from matplotlib.patches import Rectangle

class MandelbrotVisualizer:
    def __init__(self, renderer):
        """
        Initialize visualizer.

        Args:
            renderer: MandelbrotRenderer instance
        """
        self.renderer = renderer

        # Color maps to try
        self.colormaps = ['hot', 'viridis', 'twilight', 'gist_earth', 'nipy_spectral']
        self.current_cmap = 0

    def show(self, fractal_data, title="Mandelbrot Set"):
        """
        Display fractal with nice color mapping.

        Args:
            fractal_data: 2D array of iteration counts
            title: Plot title
        """
        fig, ax = plt.subplots(figsize=(10, 10))

        # Logarithmic color scale for better visualization
        # Points in set (max_iter) shown in black
        max_iter = fractal_data.max()
        color_data = np.log(fractal_data + 1)  # +1 to avoid log(0)

        img = ax.imshow(
            color_data,
            cmap=self.colormaps[self.current_cmap],
            origin='lower',
            extent=[-2.5, 1.0, -1.25, 1.25],  # Default Mandelbrot bounds
            interpolation='bilinear'
        )

        ax.set_title(title)
        ax.set_xlabel('Real axis')
        ax.set_ylabel('Imaginary axis')

        plt.colorbar(img, ax=ax, label='log(iterations)')
        plt.tight_layout()
        plt.show()

    def interactive_explorer(self, width=1024, height=1024, initial_max_iter=256):
        """
        Interactive explorer with click-to-zoom.

        Click on plot to zoom into that region.
        Press 'r' to reset view.
        Press 'c' to cycle color maps.
        Press 'q' to quit.
        """
        # Initial view (full Mandelbrot set)
        x_min, x_max = -2.5, 1.0
        y_min, y_max = -1.25, 1.25
        max_iter = initial_max_iter

        # Zoom history for undo
        view_history = [(x_min, x_max, y_min, y_max, max_iter)]

        # Render initial view
        fractal = self.renderer.render(width, height, x_min, x_max, y_min, y_max, max_iter)

        # Setup plot
        fig, ax = plt.subplots(figsize=(12, 12))
        color_data = np.log(fractal + 1)
        img = ax.imshow(
            color_data,
            cmap=self.colormaps[self.current_cmap],
            origin='lower',
            extent=[x_min, x_max, y_min, y_max],
            interpolation='bilinear',
            picker=True
        )

        ax.set_title(f'Mandelbrot Set (max_iter={max_iter})')
        ax.set_xlabel('Real axis')
        ax.set_ylabel('Imaginary axis')
        plt.colorbar(img, ax=ax, label='log(iterations)')

        instructions = ax.text(
            0.02, 0.98,
            'Click: Zoom | R: Reset | C: Color | Q: Quit | U: Undo',
            transform=ax.transAxes,
            va='top',
            fontsize=10,
            bbox=dict(boxstyle='round', facecolor='wheat', alpha=0.8)
        )

        def on_click(event):
            nonlocal x_min, x_max, y_min, y_max, max_iter, fractal

            if event.inaxes != ax:
                return

            # Get click coordinates
            click_x, click_y = event.xdata, event.ydata

            # Zoom factor
            zoom = 0.25  # Show 25% of current view

            # New bounds centered on click
            x_range = (x_max - x_min) * zoom
            y_range = (y_max - y_min) * zoom

            x_min_new = click_x - x_range / 2
            x_max_new = click_x + x_range / 2
            y_min_new = click_y - y_range / 2
            y_max_new = click_y + y_range / 2

            # Increase iterations for deeper zooms
            max_iter = min(max_iter + 128, 2048)

            # Save to history
            view_history.append((x_min_new, x_max_new, y_min_new, y_max_new, max_iter))

            # Render new view
            print(f"\nZooming to ({click_x:.6f}, {click_y:.6f})...")
            fractal = self.renderer.render(
                width, height,
                x_min_new, x_max_new, y_min_new, y_max_new,
                max_iter
            )

            # Update plot
            x_min, x_max = x_min_new, x_max_new
            y_min, y_max = y_min_new, y_max_new

            color_data = np.log(fractal + 1)
            img.set_data(color_data)
            img.set_extent([x_min, x_max, y_min, y_max])
            ax.set_title(f'Mandelbrot Set (max_iter={max_iter})')
            fig.canvas.draw_idle()

        def on_key(event):
            nonlocal x_min, x_max, y_min, y_max, max_iter, fractal

            if event.key == 'r':
                # Reset to initial view
                print("\nResetting view...")
                x_min, x_max = -2.5, 1.0
                y_min, y_max = -1.25, 1.25
                max_iter = initial_max_iter
                view_history.clear()
                view_history.append((x_min, x_max, y_min, y_max, max_iter))

                fractal = self.renderer.render(width, height, x_min, x_max, y_min, y_max, max_iter)
                color_data = np.log(fractal + 1)
                img.set_data(color_data)
                img.set_extent([x_min, x_max, y_min, y_max])
                ax.set_title(f'Mandelbrot Set (max_iter={max_iter})')
                fig.canvas.draw_idle()

            elif event.key == 'c':
                # Cycle color map
                self.current_cmap = (self.current_cmap + 1) % len(self.colormaps)
                img.set_cmap(self.colormaps[self.current_cmap])
                print(f"\nColor map: {self.colormaps[self.current_cmap]}")
                fig.canvas.draw_idle()

            elif event.key == 'u':
                # Undo (go back in history)
                if len(view_history) > 1:
                    view_history.pop()  # Remove current
                    x_min, x_max, y_min, y_max, max_iter = view_history[-1]

                    print("\nUndoing zoom...")
                    fractal = self.renderer.render(width, height, x_min, x_max, y_min, y_max, max_iter)
                    color_data = np.log(fractal + 1)
                    img.set_data(color_data)
                    img.set_extent([x_min, x_max, y_min, y_max])
                    ax.set_title(f'Mandelbrot Set (max_iter={max_iter})')
                    fig.canvas.draw_idle()

            elif event.key == 'q':
                plt.close(fig)

        fig.canvas.mpl_connect('button_press_event', on_click)
        fig.canvas.mpl_connect('key_press_event', on_key)

        plt.tight_layout()
        plt.show()

    def compare_julia_sets(self, c_values, width=512, height=512):
        """
        Display multiple Julia sets side-by-side.

        Args:
            c_values: List of (real, imag) tuples
            width, height: Resolution per image
        """
        n = len(c_values)
        cols = min(3, n)
        rows = (n + cols - 1) // cols

        fig, axes = plt.subplots(rows, cols, figsize=(5*cols, 5*rows))
        if n == 1:
            axes = [axes]
        else:
            axes = axes.flatten()

        for ax, (c_real, c_imag) in zip(axes[:n], c_values):
            julia = self.renderer.render_julia(
                width, height,
                c_real, c_imag,
                max_iter=256
            )

            color_data = np.log(julia + 1)
            ax.imshow(color_data, cmap='twilight', origin='lower')
            ax.set_title(f'c = {c_real:.3f} + {c_imag:.3f}i')
            ax.axis('off')

        # Hide unused subplots
        for ax in axes[n:]:
            ax.axis('off')

        plt.tight_layout()
        plt.show()
Running the Project
Quick Start - Click to Run:
cd ~/tt-scratchpad/cookbook/mandelbrot && export PYTHONPATH=~/tt-metal:$PYTHONPATH && python3 -c "from renderer import MandelbrotRenderer; from explorer import MandelbrotVisualizer; import ttnn; device = ttnn.open_device(device_id=0); renderer = MandelbrotRenderer(device); viz = MandelbrotVisualizer(renderer); viz.interactive_explorer(width=1024, height=1024); ttnn.close_device(device)"
cd ~/tt-scratchpad/cookbook/mandelbrot && export PYTHONPATH=~/tt-metal:$PYTHONPATH && python3 -c "from renderer import MandelbrotRenderer; from explorer import MandelbrotVisualizer; import ttnn; device = ttnn.open_device(device_id=0); renderer = MandelbrotRenderer(device); viz = MandelbrotVisualizer(renderer); c_values = [(-0.4, 0.6), (0.285, 0.01), (-0.70176, -0.3842), (-0.835, -0.2321), (-0.8, 0.156), (0.0, -0.8)]; viz.compare_julia_sets(c_values); ttnn.close_device(device)"
Manual Commands:
cd ~/tt-scratchpad/cookbook/mandelbrot

# Activate TT environment (choose for your setup):
tt-metal                                          # tt-developer-image / Docker
# source ~/.tenstorrent-venv/bin/activate         # QB2 pre-installed image
# source /opt/venv-metal/bin/activate             # cloud / custom install

# Basic render
python3 renderer.py
Interactive explorer:
python3 -c "
from renderer import MandelbrotRenderer
from explorer import MandelbrotVisualizer
import ttnn

device = ttnn.open_device(device_id=0)
renderer = MandelbrotRenderer(device)
viz = MandelbrotVisualizer(renderer)

# Launch interactive explorer
viz.interactive_explorer(width=1024, height=1024)

ttnn.close_device(device)
"
Compare Julia sets:
python3 -c "
from renderer import MandelbrotRenderer
from explorer import MandelbrotVisualizer
import ttnn

device = ttnn.open_device(device_id=0)
renderer = MandelbrotRenderer(device)
viz = MandelbrotVisualizer(renderer)

# Interesting Julia set parameters
c_values = [
    (-0.4, 0.6),      # Dendrite
    (0.285, 0.01),    # Douady rabbit
    (-0.70176, -0.3842),  # San Marco
    (-0.835, -0.2321),    # Siegel disk
    (-0.8, 0.156),    # Quasi-spiral
    (0.0, -0.8),      # Classic
]

viz.compare_julia_sets(c_values)

ttnn.close_device(device)
"
Extensions
1. Burning Ship Fractal
# In the iteration loop, use abs(z) instead of z:
z_real_new = ttnn.subtract(
    ttnn.square(ttnn.abs(z_real)),
    ttnn.square(ttnn.abs(z_imag))
)
z_real_new = ttnn.add(z_real_new, c_real)
2. 3D Mandelbulb
Extend to 3D using spherical coordinates.
3. Deep Zoom Videos
Record zooms to create mesmerizing videos:
def render_zoom_sequence(self, target_x, target_y, num_frames=100):
    """Render frames for zoom animation."""
    frames = []
    for i in range(num_frames):
        zoom_factor = 0.95 ** i  # Exponential zoom
        # ... render and save frame
    return frames
4. Performance Profiling
# Compare different resolutions
for size in [512, 1024, 2048, 4096]:
    fractal = renderer.render(size, size, -2.5, 1.0, -1.25, 1.25, 256)
Bonus: Julia Set Comparison
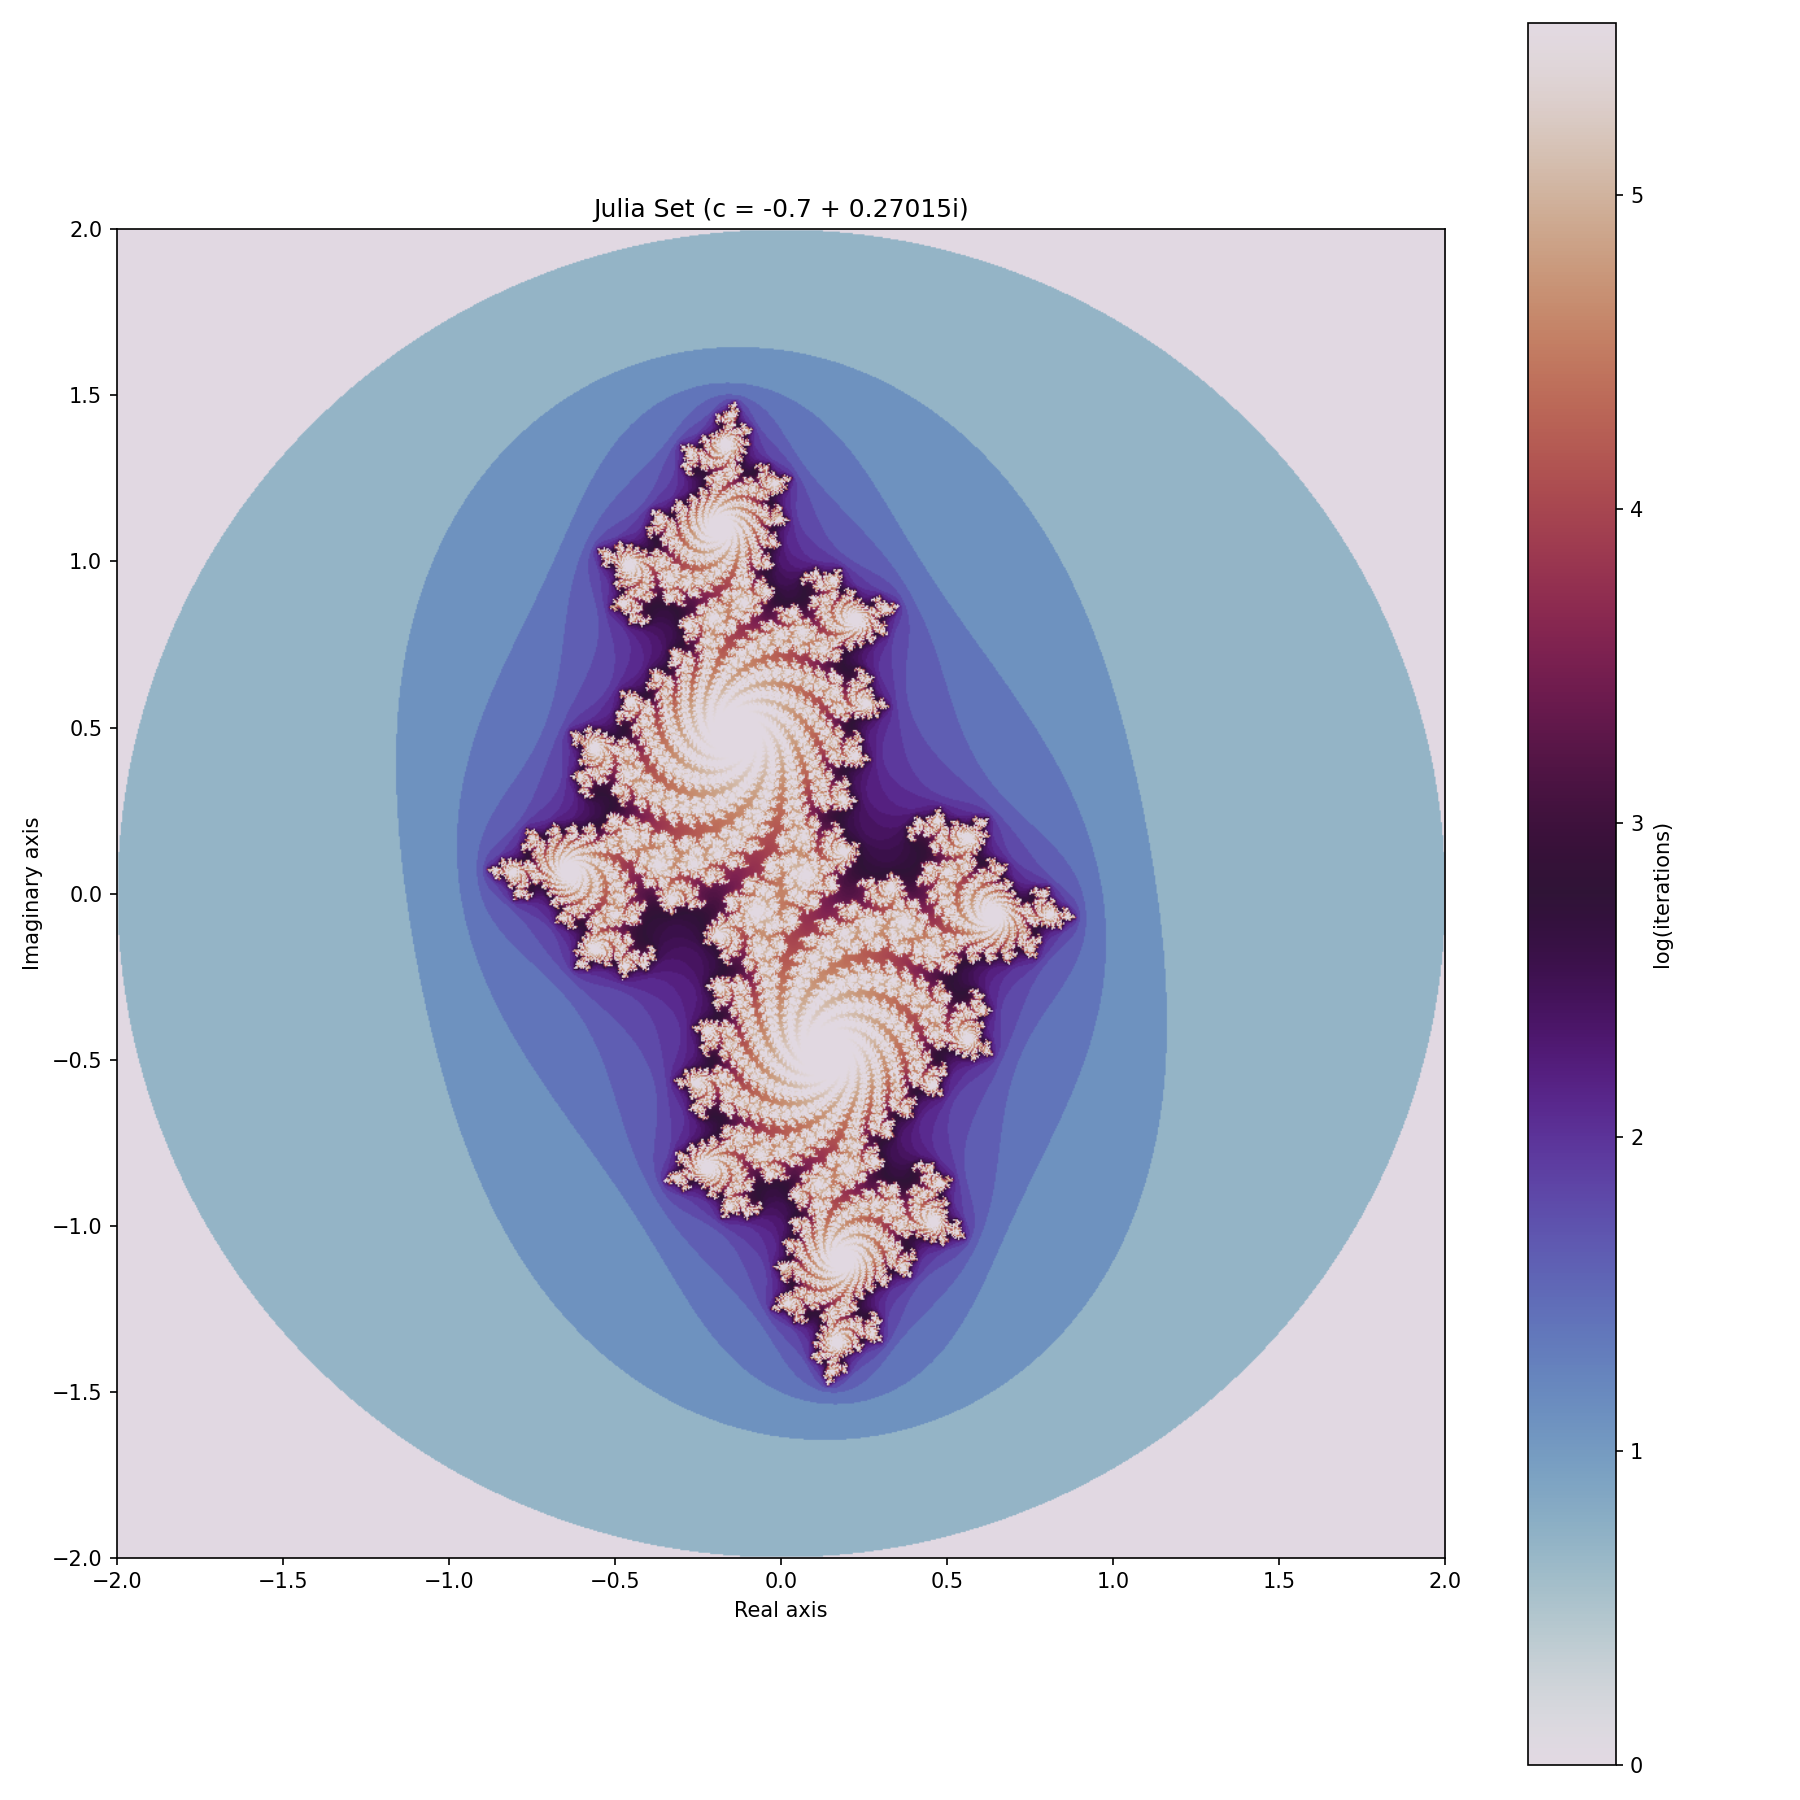
Six different Julia sets side-by-side, each with different complex parameter c. Notice how slight changes in c create dramatically different patterns.
What You Learned
- ✅ Embarrassingly parallel computation: Each pixel computed independently
- ✅ Complex number operations: Iterative z = z² + c calculations
- ✅ Performance optimization: Benchmarking and scaling analysis
- ✅ Interactive visualization: Zoom, pan, and color mapping